Join Our Telegram channel to stay up to date on breaking news coverage
ETH Price Prediction – September 21
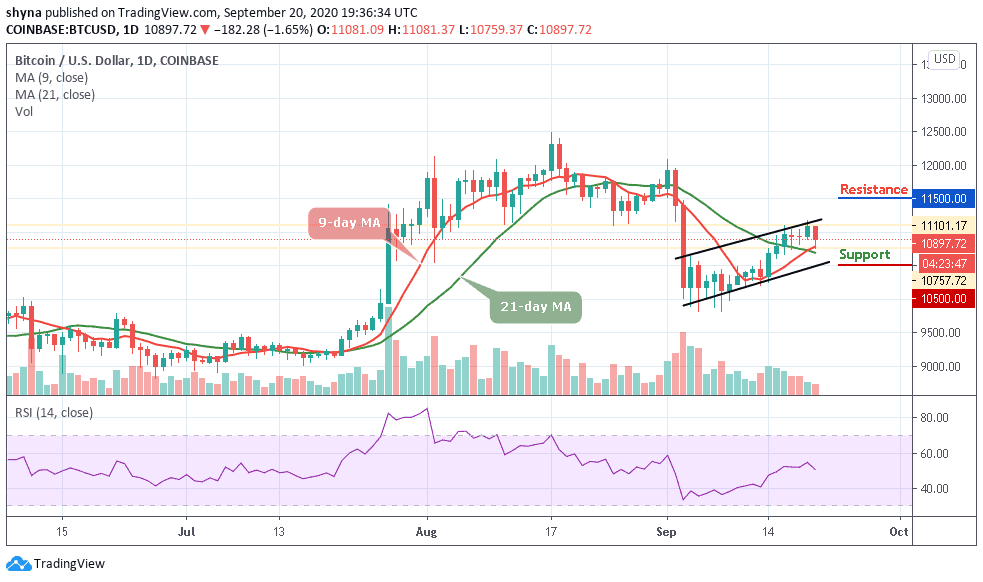
The price of Ethereum is approaching a crucial support level, similar to Bitcoin (BTC).
ETH/USD Market
Key Levels:
Resistance levels: $400, $420, $440
Support levels: $300, $280, $260

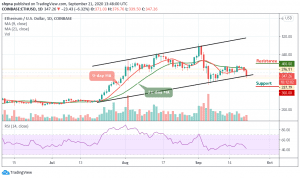
At the time of writing, ETH/USD is trading down 6.32% at its current price of $347.26, which marks a notable decline from its daily highs of $376.76 that was set today when the bulls attempted to spark another rally. In the near-term, ETH/USD has been able to find some support in the lower $340 level, as it has bounced multiple times after visiting this level.
What to Expect from Litecoin (LTC)
ETH/USD is currently following the bearish trend with a tremendous price drop. Many traders were expecting a lot from the coin before it suddenly changes to the downside. Although the majority of the altcoins started trading today with a fall. The Ethereum price is currently moving under the 9-day and 21-day moving averages but yet to break below the lower boundary of the channel.
Moreover, a bearish drop may continue to roll the market down to the support level of $300, $280, and $260 while a possible bullish surge may drive the market above the 9-day and 21-day moving averages to the $385 level. Meanwhile, the $300, $280, and $260 may further provide resistance levels for the market. The technical indicator RSI (14) is facing the negative side and staying there would cause the coin to fall below the $320 support level again.
Against Bitcoin, the market price remains below the 9-day and 21-day moving averages, the bears are already taking over the market. ETH/BTC is currently trading at 0.0324 BTC and the bulls failed to push the price upward. Meanwhile, if the market continues to drop, the next key supports could be 0.0300 BTC and below.
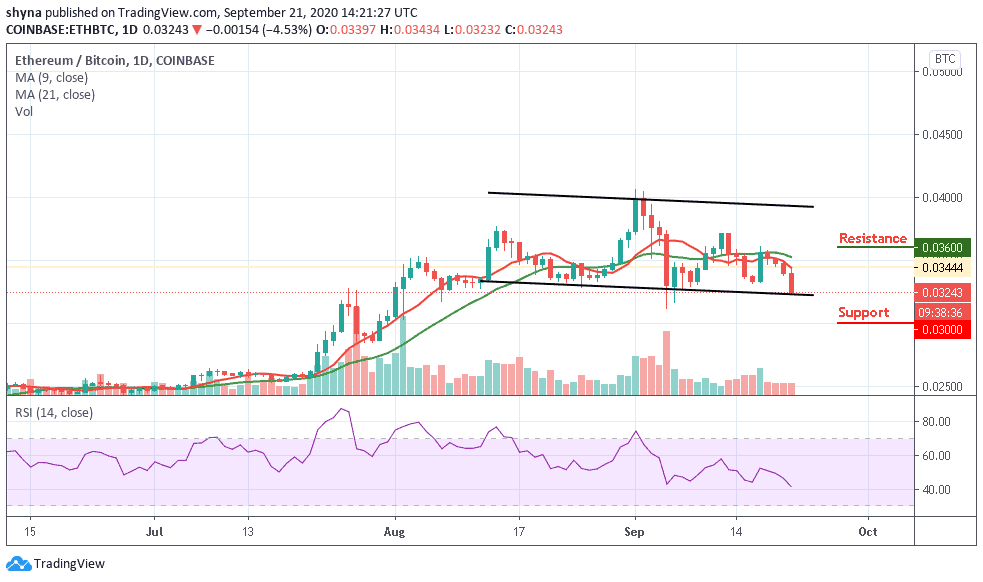
However, on the upside, a possible bullish movement may surface and may likely push the market to cross above the moving averages, once this is done, the resistance level of 0.0360 BTC and above may be visited. As for now, the RSI (14) is seen moving below 40-level, suggesting that the market may continue to fall.
Join Our Telegram channel to stay up to date on breaking news coverage