Join Our Telegram channel to stay up to date on breaking news coverage
ETH Price Prediction – April 6
ETH/USD must break and close back above the $2150 price mark, for further upside.
ETH/USD Market
Key Levels:
Resistance levels: $2300, $2400, $2500
Support levels: $1900, $1800, $1700
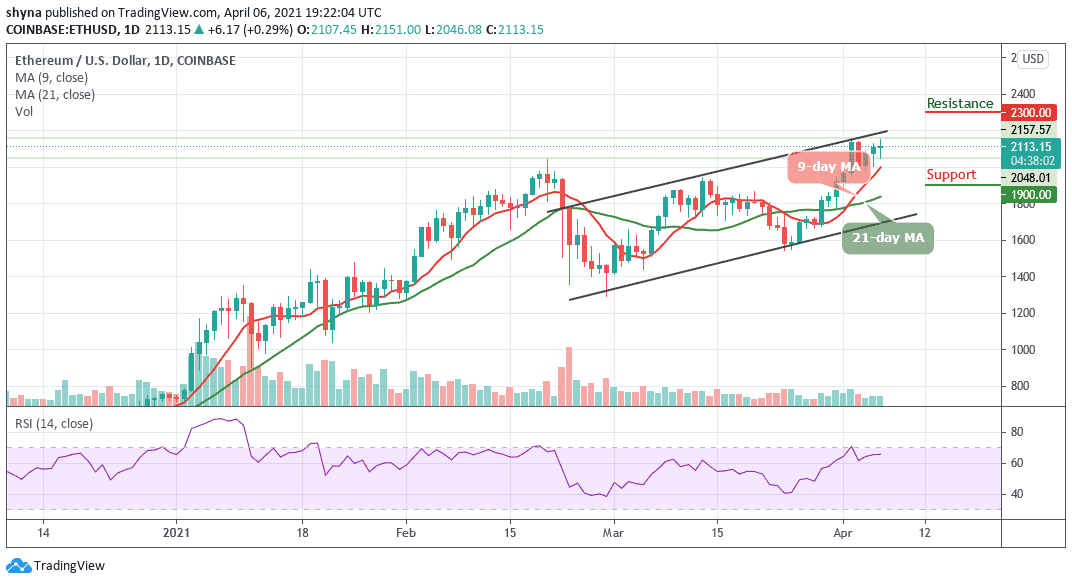
At the time of writing, ETH/USD is seen trading at $2113.15 after recording an intraday high at $2151 in the opening hour of today. Looking at the daily chart, Ethereum (ETH) has failed to follow in the footsteps of the granddaddy of the digital market (BTC) as its margin of gains has been limited this time around. ETH/USD is still above the 9-day and 21-day moving averages after recovering from the daily low of $2046.
Where is ETH Price Going Next?
The highest value Ethereum has had within the last 10 days was $2145 and today it touches the high of $2151. ETH/USD can be expected to rise from this current high to $2200 in the next one-week as the ongoing trend may move a little bit higher in the coming week. The Ethereum price may cross above the channel to touch the nearest resistance at $2250. Therefore, as the red-line of 9-day MA is still well above the green-line of 21-day MA, the coin may continue to do well and the price could hit the resistance levels at $2300, $2400, and $2500 respectively.
Meanwhile, should the technical indicator decide to make a quick turn to the south, there may be a cross below the 9-day moving average and the bearish drop may likely roll the market down to the support levels of $1900, $1800, and $1700 as the technical indicator RSI (14) moves around the 65-level.
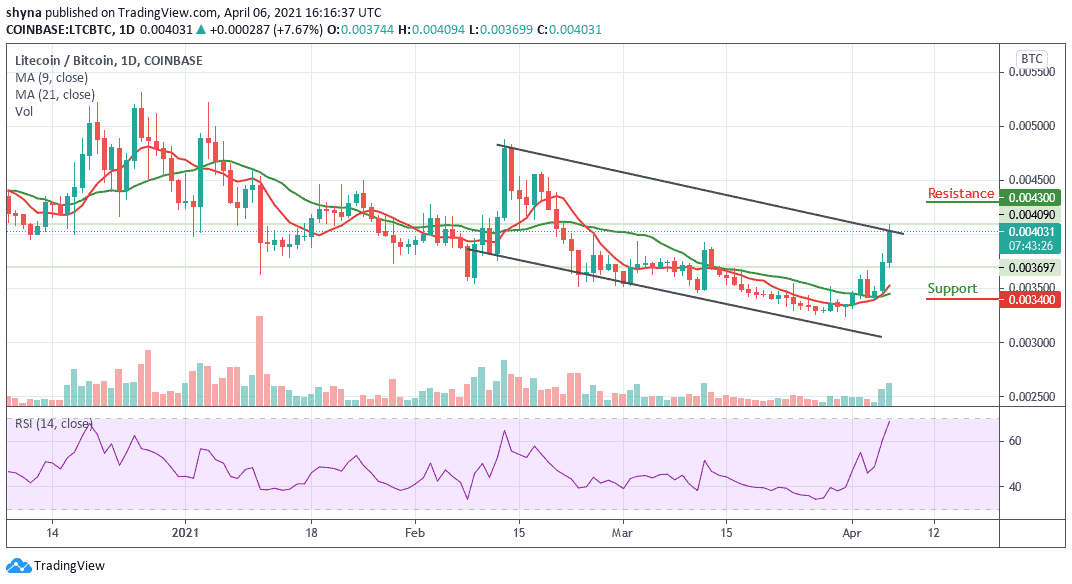
When compares with Bitcoin, as the green-line of 21-day MA is below the red-line of 9-day MA, the market price focuses on the upward movement within the descending channel. ETH/BTC is currently trading at the 3628 SAT and if the market continues to rise, the next key resistance may likely be at 3900 SAT and above.
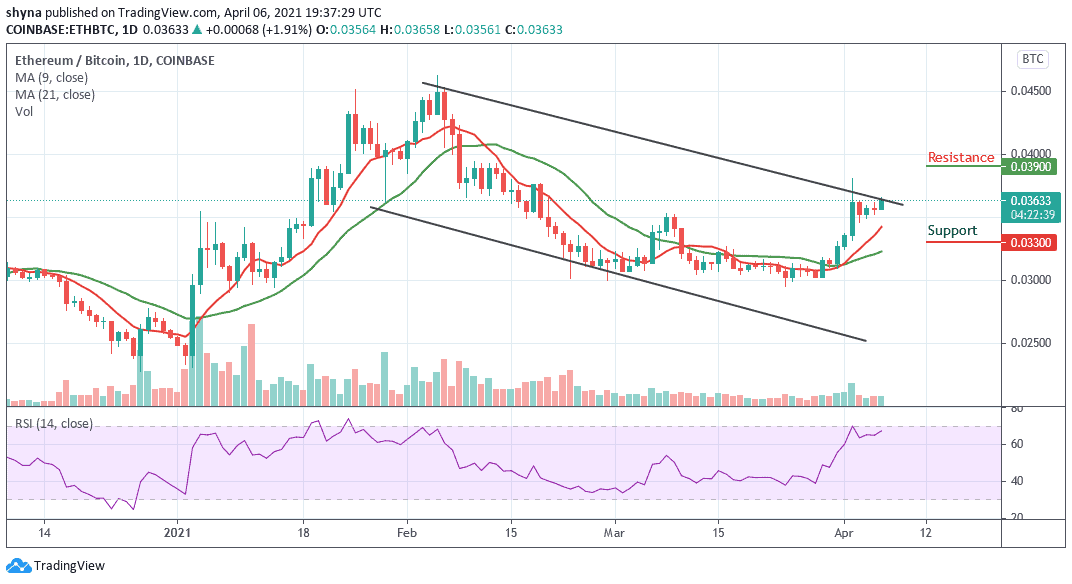
On the downside, a possible bearish movement below the 9-day moving average may likely come into play, when this is done, the support level of 3300 SAT and below could be visited. Meanwhile, the market may have a bullish day today because the RSI (14) indicator moves above 65-level, which could give more bullish signals for a while.
Join Our Telegram channel to stay up to date on breaking news coverage