Join Our Telegram channel to stay up to date on breaking news coverage
ETH Price Prediction – April 1
After several days of bullish momentum, Ethereum (ETH) opened at $1,919 as the coin breaks the previous significant swing high of $1,950.
ETH/USD Market
Key Levels:
Resistance levels: $2100, $2200, $2300
Support levels: $1800, $1700, $1600
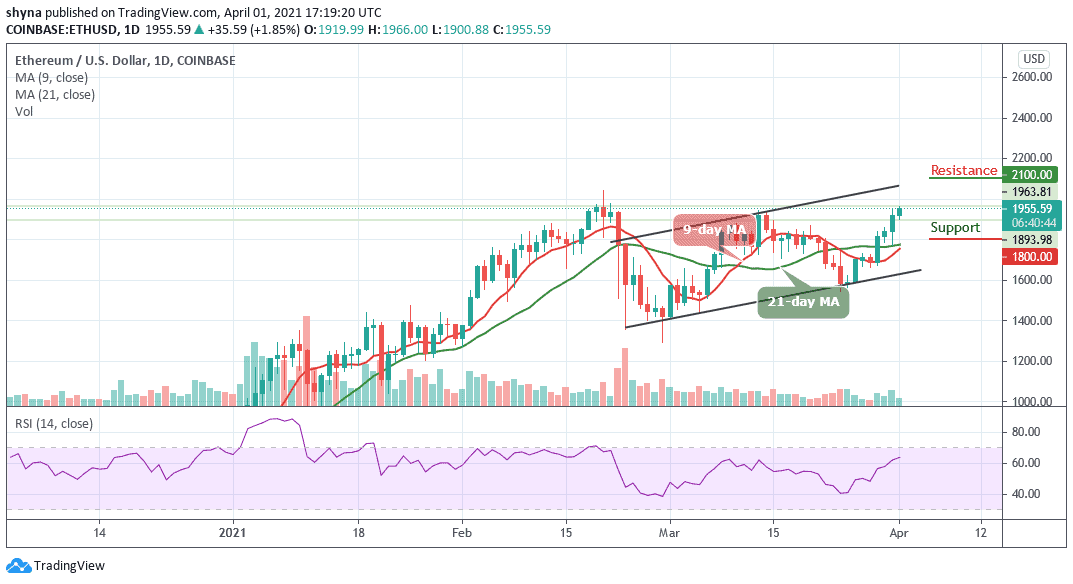
ETH/USD price is currently indicating a good amount of volatility as the trading volume increased by 30%, meaning an increased market interest is likely to push the market price above the previous swing high. The second-largest crypto is currently trading at $1,955 with a bullish movement above the 9-day and 21-day moving averages.
Where is ETH Price Going Next?
If there is an upside break above $1950, the price could test the $2000 resistance level. Any further gains might push the price towards the $2100, $2200, and $2300 resistance levels. On the downside, the $1850 level is initial support and if there are more downsides, the price could test the critical support levels of $1800, $1600, and $1500, where the bulls are likely to take a stand.
However, ETH/USD is now showing some positive signs above the $1950, but it might rise further in the short term. More so, ETH/USD may continue to bounce above $1950, as long as there is no daily close below $1800. However, the technical indicator RSI (14) is seen crossing above 60-level to increase the bullish movement in the market.
Against Bitcoin, the market price remains within the descending channel as the bulls are currently dominating the market. More so, ETH/BTC is trading at 0.033 BTC and the bulls are pushing the price to cross above the upper boundary of the channel. Looking at the chart, if the market continues to rise, the next key resistance may likely be at 0.035 BTC and above.
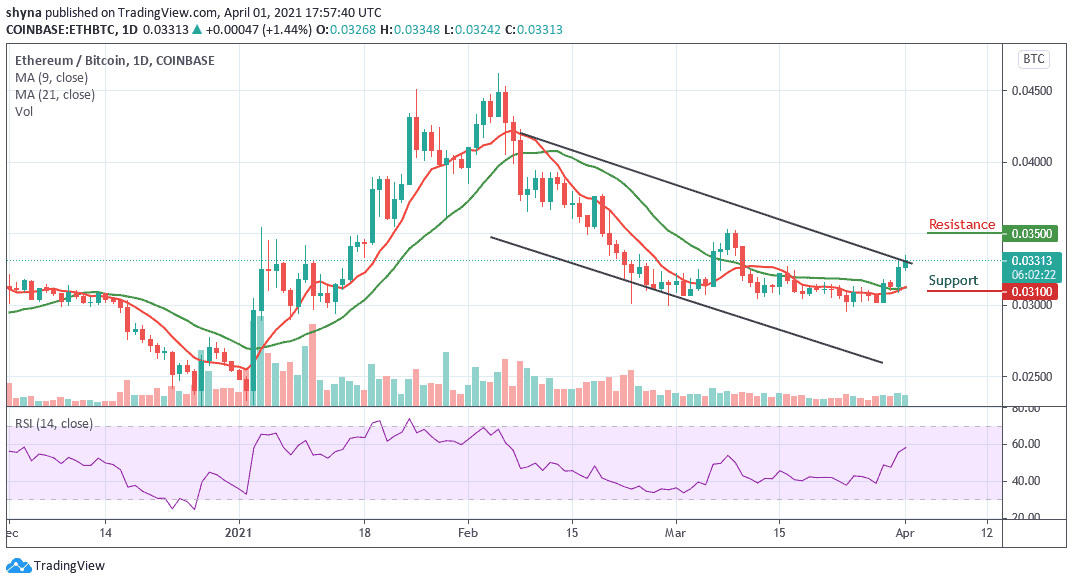
However, on the downside, a possible bearish movement may likely push the market below the moving averages, immediately after this, the support level of 0.031 BTC and below could be visited. Meanwhile, the technical indicator RSI (14) is moving above the 55-level and this is suggesting that the market may continue to go up.
Join Our Telegram channel to stay up to date on breaking news coverage