Join Our Telegram channel to stay up to date on breaking news coverage
ETH Price Prediction – March 25
The Ethereum (ETH) is currently trading above $1600 after a significant dip towards $1500.
ETH/USD Market
Key Levels:
Resistance levels: $1800, $1900, $200
Support levels: $1400, $1300, $1200
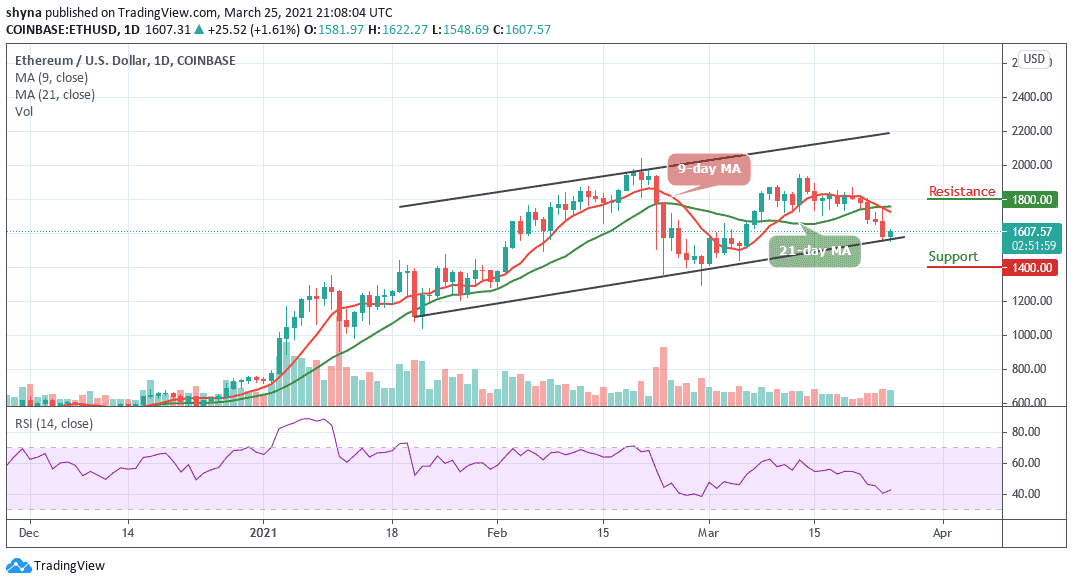
At the time of writing, ETH/USD is trading at $1607 where a bearish momentum is building. Looking at the daily chart, the technical indicator RSI (14) shows that the bearish 40-level momentum may be coming into focus after nose-diving below 45-level. However, the 9-day and 21-day moving averages suggest bears have the ability to control as the 9-day MA is crossing below the 21-day MA.
What to Expect from Ethereum
The Ethereum price now hovers below the moving averages and trades around the lower boundary of the channel. Meanwhile, any sustainable move above this barrier may improve the bullish movement and allow for an extended recovery towards the resistance level of $1700. More so, once the coin stays above this level, it could negate the bearish scenario and bring the nearest resistance of $1400, $1300, and $1200 levels into view.
Meanwhile, the RSI (14) on the daily chart points downwards, signaling that strong upside momentum is less likely at this stage. Meanwhile, a failure to regain the ground could worsen the technical picture and lay the ground for the further sell-off towards psychological support created by $390. This barrier is reinforced by the 9-day MA and has the potential to slow down the bears. Any further bearish movement could be located at $375, $365, and $355 support levels.
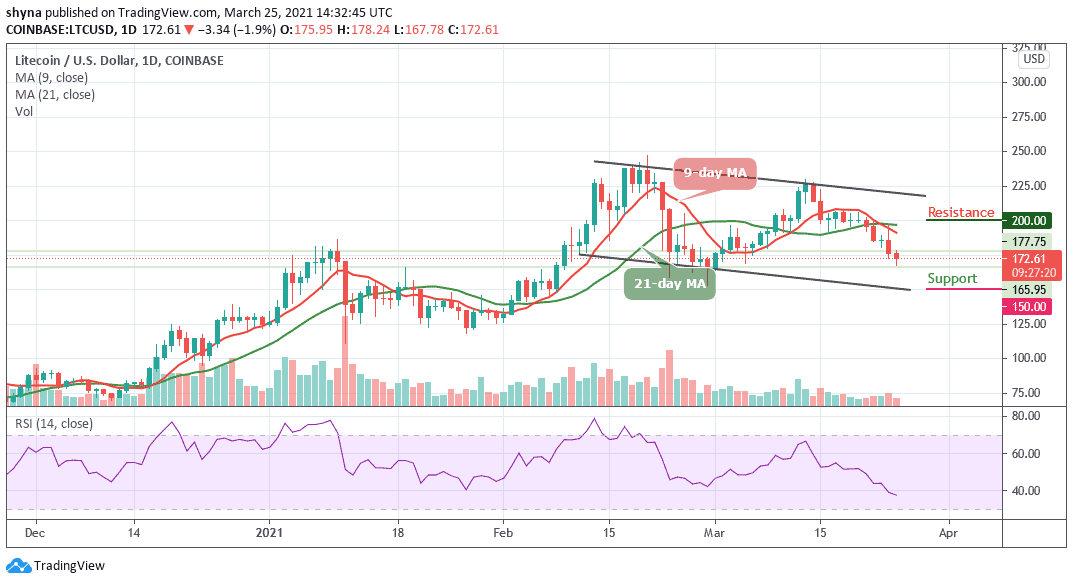
Against Bitcoin, the market price remains within the descending channel as the bears are dominating the market. More so, ETH/BTC is currently trading at 0.030 BTC and the bulls couldn’t push the price to cross above the 9-day and 21-day moving averages. Looking at the chart, if the market continues to drop, the next key supports may likely be at 0.027 BTC and below.
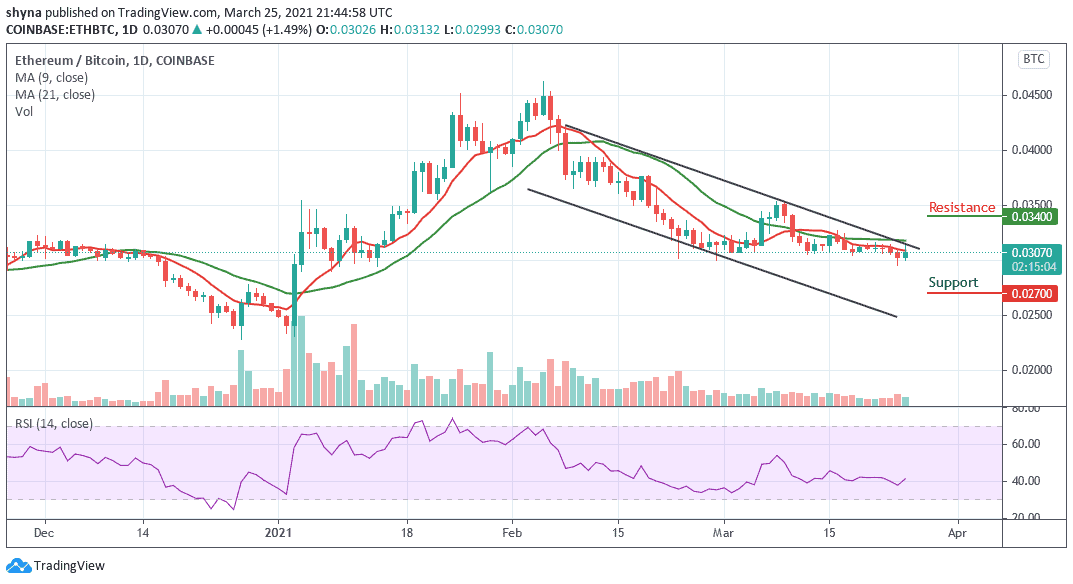
However, on the upside, a possible bullish movement may likely push the market above the moving averages, immediately after this, the resistance level of 0.034 BTC and above could be visited. Meanwhile, the technical indicator RSI (14) is moving above the 40-level and this is suggesting that the market may likely go up.
Join Our Telegram channel to stay up to date on breaking news coverage