Join Our Telegram channel to stay up to date on breaking news coverage
ETH Price Prediction – March 13
The Ethereum steady bullish action is breaking above the $1800 barrier; although, eyes currently glued on $1900.
ETH/USD Market
Key Levels:
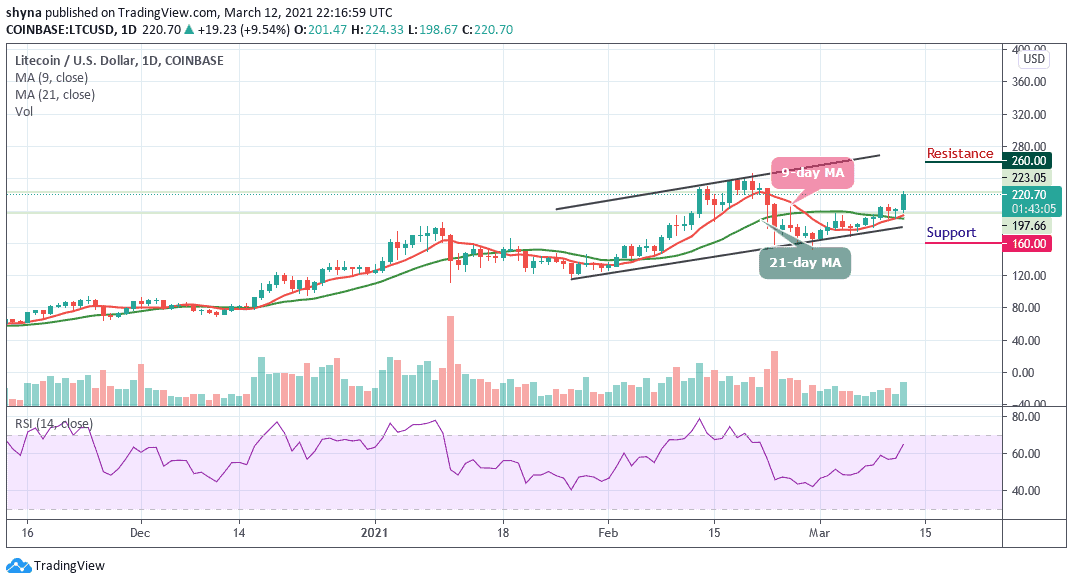
Resistance levels: $2100, $2200, $2300
Support levels: $1500, $1400, $1300

ETH/USD is seen refreshing to a new high after touching the daily low of $1720 to breaches above $1800 while currently trades at $1877 with a bullish crossover above the 9-day moving average. While bears are attempting to increase selling pressure near the $1,800 level, the bulls are trying to collect more on the price dips.
Where is ETH Price Going Next?
For Ethereum, the coin can only maintain the uptrend if the $1900 subsidy is maintained at all costs. Currently, the technical indicator RSI (14) is seen crossing above the 60-level at the moment by sending bullish signals into the market which can finally encourage more buyers to enter the market.
Meanwhile, in as much as the red-line of 9-day MA remains above the green-line of 21-day MA, the coin may continue to do well and the price could hit the resistance levels at $2100, $2200, and $2300 respectively. More so, if the technical indicator decides to make a quick turn back below the moving averages, then, there may be a quick bearish drop which may likely roll the market down to the support levels of $1500, $1400, and $1300 respectively.
When compares with Bitcoin, Ethereum is trading below the 9-day and 21-day moving averages as the price hovers at 0.031 SAT. Meanwhile, the technical indicator RSI (14) is seen moving above the 40-level. For the fact that the market remains at the downside, the pair seems to be moving sideways before deciding on the next direction.

Moreover, the daily chart reveals that the potential resistance levels are located at 3800 SAT and above but a higher sustainable move may likely cancel the bullish pattern which could attract new buyers coming into the market with the next focus on the support levels of 2400 SAT and below.
Join Our Telegram channel to stay up to date on breaking news coverage