Join Our Telegram channel to stay up to date on breaking news coverage
ETH Price Prediction – March 9
Ethereum (ETH) loses 0.6% at the time of writing as the price goes below the $1850 level. The next target support may come at $1800.
ETH/USD Market
Key Levels:
Resistance levels: $2100, $2200, $2300
Support levels: $1500, $1400, $1300

ETH/USD breaks below $1850 after an unsuccessful attempt to settle above $1859 handle during early Asian hours. At the time of writing, ETH/USD is changing hands at $1823, down 0.6% after touching the daily high of $1859. For the past few days, bulls have so far been pushing the market price above the 9-day and 21-day moving averages, hoping to revisit the potential $2000 resistance level.
What to Expect from Ethereum (ETH)
According to the daily chart, a break above the resistance level of $2000 could most likely give ETH/USD a boost towards the important resistance at $2100, $2200, and $2300 levels. On the downside, the technical indicator RSI (14) has a bearish feel after crossing above 60-level. The first support lies at $1800 this is after $1859 failed to hold in the session after opening today.
However, if the coin crosses below the moving averages, Ethereum could revisit $1550 support. Besides, the market price may keep moving upward as long as the 9-day moving average crosses above the 21-day moving average. Meanwhile, the critical support levels to keep eye on are $1500, $1400, and $1300 which are below the lower boundary of the channel.
Against Bitcoin, we can see that Ethereum is clearly bearish. As the price falls, sellers are posing an additional threat for buyers to reach the support level of 3380 SAT where the nearest target is located. However, an eventual break below the 9-day and 21-day moving averages may cause Ethereum to collapse more.
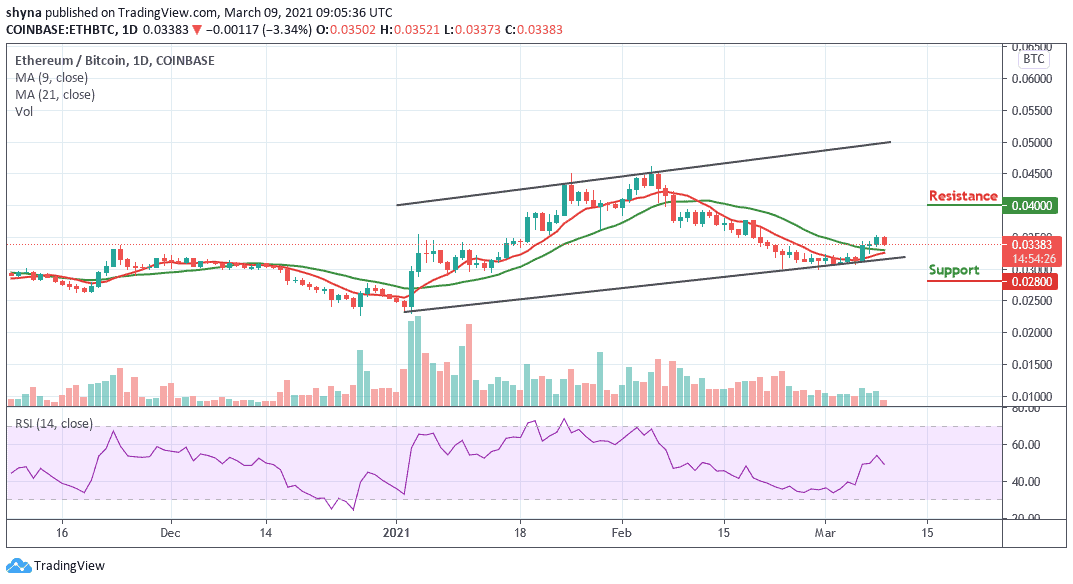
Meanwhile, the continuation of the downtrend could hit the main supports below the channel before falling to 2800 SAT and below. Meanwhile, a bullish trend may likely push the market to the potential resistance at 4000 SAT and above if a rebound plays out. The technical indicator RSI (14) confirms the bearish movement as the signal nosedives below the 54-level, suggesting that more bearish movements may play out.
Join Our Telegram channel to stay up to date on breaking news coverage