Join Our Telegram channel to stay up to date on breaking news coverage
ETH Price Prediction – February 15
ETH/USD is still struggling to stay above $1900 as the entire market takes a brief pause.
ETH/USD Market
Key Levels:
Resistance levels: $2100, $2200, $2300
Support levels: $1500, $1400, $1300
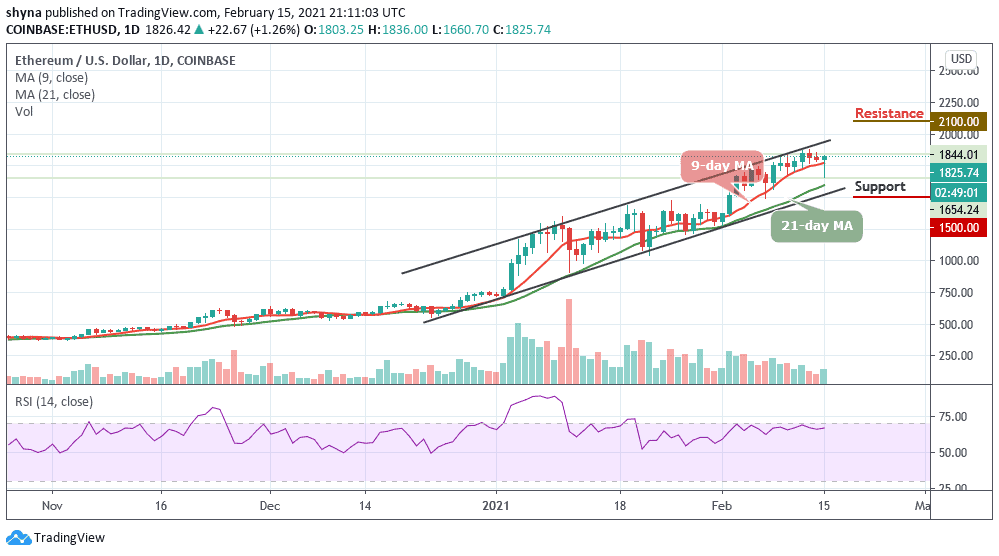
ETH/USD is currently recovering above $1800 and it is likely to climb above $1900 soon. Ethereum has remained relatively flat for the past few days as bulls and bears are fighting for the $1600 level. The yearly-high remains at $1877 with the nearest support level located at $160 in the short-term.
Where is Ethereum Price Going Next?
If Ethereum price breaks above the upper boundary of the channel, it could test an important resistance at $1900. However, a successful break above the channel could open the doors for a fresh increase above the $2000 level. In the mentioned case, the price is likely to rise towards the $2100, $2200, and $2300 resistance levels in the coming sessions.
Moreover, as the technical indicator RSI (14) moves above the 65-level, which means that the market remains at the upside but breaking below this level, may cause the coin to cross below the 9-day moving average. Therefore, if there is a bearish break below the 9-day MA, ETH/USD could test the $1600 support. The next major support is near the 21-day MA, where the bulls are likely to take a strong stand. Any further losses could lead the price towards the $1500, $1400, and $1300 support levels.
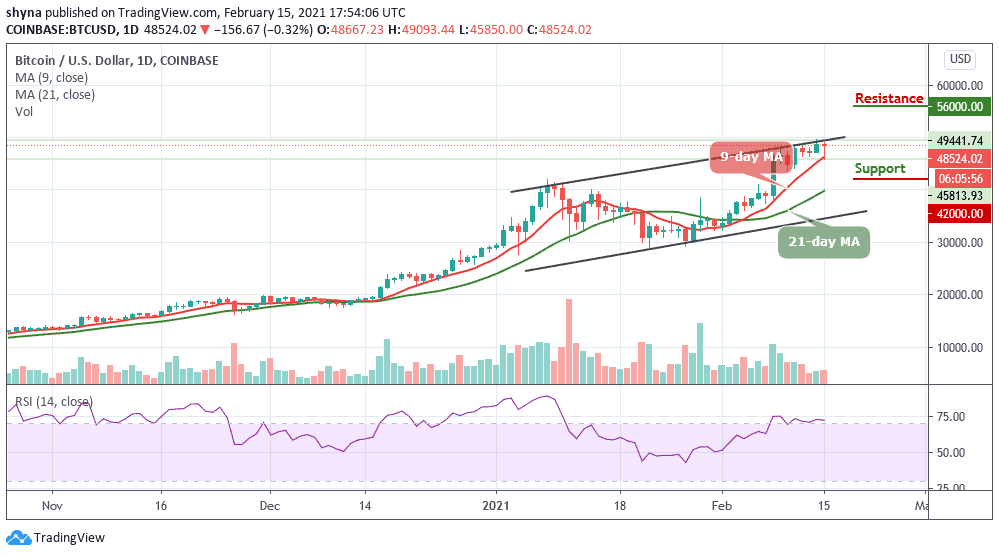
When compares with Bitcoin, the Ethereum price now moving below the 9-day and 21-day moving averages as the market keeps changing trend; approaching the lower boundary of the channel. Meanwhile, the technical indicator RSI (14) is revealed moving below 50-level, a slight bearish confirmation.
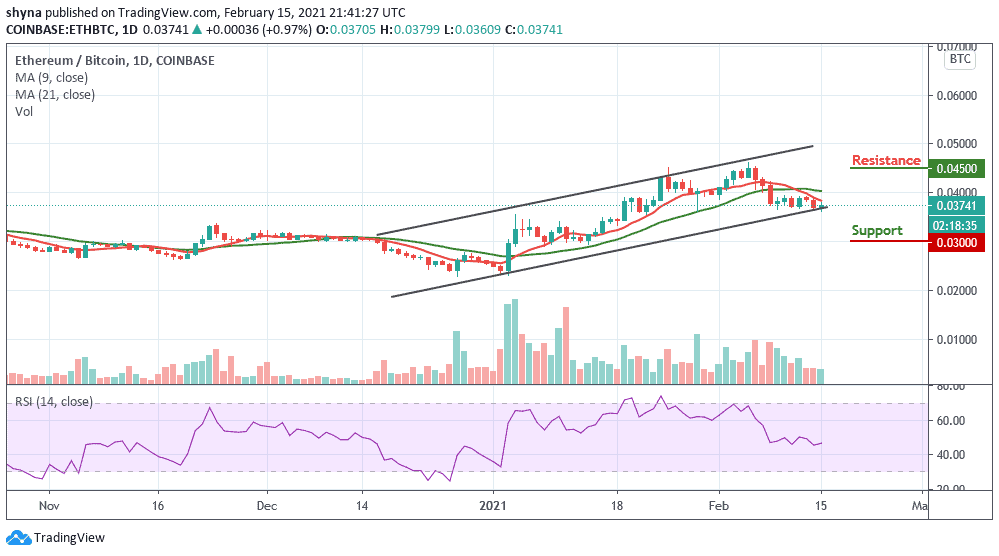
However, if the price breaks above the moving averages, bulls might push the market back to the 0.044 BTC towards the upper channel. Moreover, if the price stays above this barrier, traders may expect an immediate resistance at 0.045 BTC and above. On the other hand, crossing below the channel may locate the supports level at 0.030 BTC and below.
Join Our Telegram channel to stay up to date on breaking news coverage