Join Our Telegram channel to stay up to date on breaking news coverage
ETH Price Prediction – January 29
The Ethereum (ETH) has switched on recovery mode and it may move past the $1500 level before the end of this month.
ETH/USD Market
Key Levels:
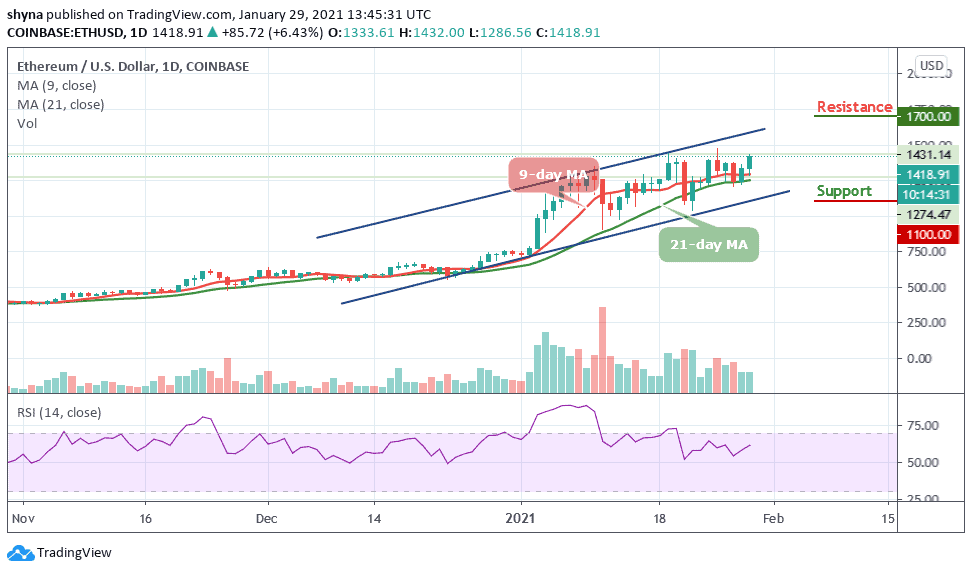
Resistance levels: $1700, $1800, $1900
Support levels: $1100, $1000, $900
This is a good time for Ethereum holders as ETH/USD is starting to show a few signs of improvement and is likely to begin to trade above $1500 in the next few days. Looking at the daily chart, the current performance of the coin in the market indicates the continuation of an uptrend and traders must therefore closely monitor this coin very well.
What to Expect from Ethereum (ETH)
ETH/USD is bullish as the market manages to set a local higher high and a higher low during the past 24 hours as the strong resistance at $1,400 holds the price from moving higher. Therefore, ETH/USD can be expected to rise towards the resistance level of $1500 before the end of the month. The on-going trend may move a little bit higher as the coin may cross above the upper boundary of the channel to touch the nearest resistance at $1500.
Moreover, if the bulls put more effort, the price could hit additional resistance levels at $1700, $1800, and $1900 respectively. Meanwhile, the support levels to watch are $1100, $1000, and $900. The technical indicator RSI (14) indicator is seen moving above 60-level, suggesting additional bullish movement.
When compares with Bitcoin, the Ethereum price slides below the 9-day moving averages. Although, the bulls are making an attempt in pushing the price upward and if they are successful, the price may likely cross above the upper boundary of the channel to hit the resistance level of 0.045 BTC and above.
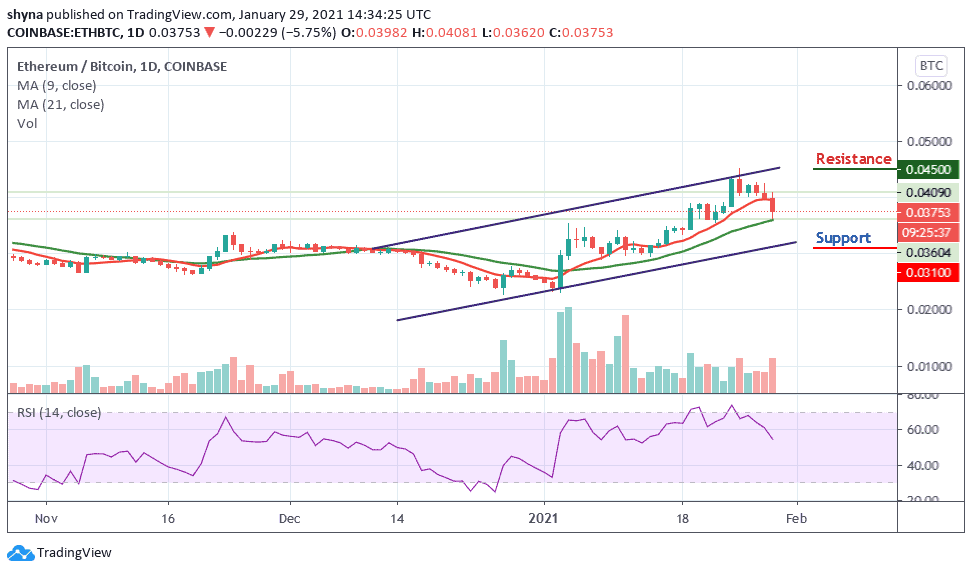
Moreover, the Ethereum price has been trending within the channel and it may likely break above the moving averages but any retracement could bring the price to the nearest support level and this may reach the major support level of 0.031 BTC and below. In other words, the technical indicator RSI (14) is seen moving below the 60-level, which may give more bearish signals in the nearest term.
Join Our Telegram channel to stay up to date on breaking news coverage