Join Our Telegram channel to stay up to date on breaking news coverage
ETH Price Prediction – January 28
Ethereum (ETH) looks unstoppable, gaining a lot of market dominance like BTC which is ready to break $35k.
ETH/USD Market
Key Levels:
Resistance levels: $1600, $1700, $1800
Support levels: $1000, $900, $800
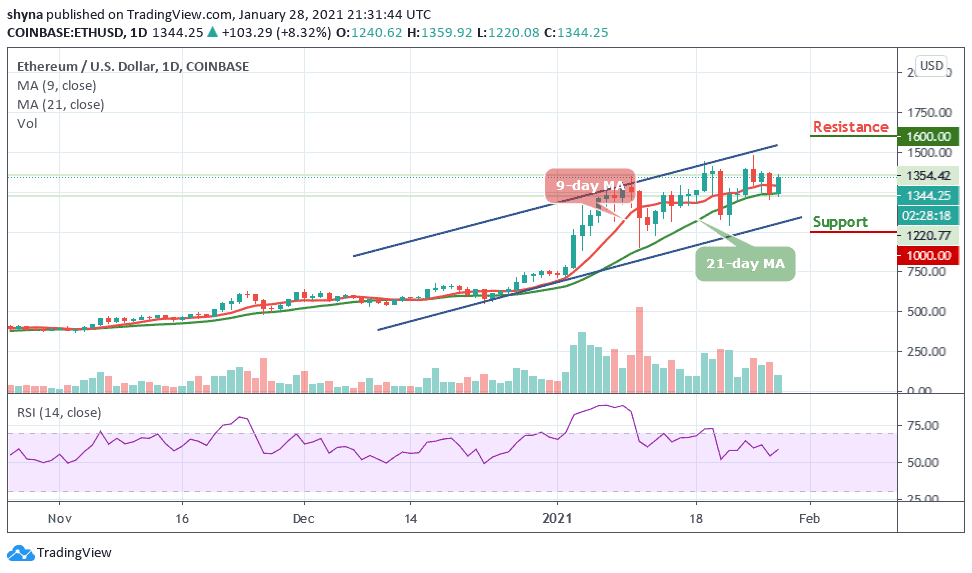
ETH/USD is seen trading at $1344 after recording an intraday high at $1359 today. The Ethereum (ETH) is gaining over 8% since the beginning of the day and touches the daily high of $1359.92. Presently, Ethereum price is changing hands above the 9-day and 21-day moving averages amid strong bullish bias. While the bulls seem to have hit a pause button, for the time being, ETH/USD may be poised for a stronger recovery as several key technical levels are left behind.
Where is Ethereum Price Going Next?
ETH/USD can be expected to rise to $1500 over the next few days while the on-going trend may move a little bit higher in the coming days. The Ethereum price may cross above the upper boundary of the channel to touch the potential resistance levels of $1600, $1700, and $1800 respectively.
However, as the RSI (14) faces the north, should the technical indicator decide to make a quick turn, there may be a cross below the moving averages and the bearish drop could roll the market down to the support levels of $1000, $900, and $800 respectively.
Against Bitcoin, the Ethereum price remains in the ascending channel as the bears could step back into the market. ETH/BTC is currently trading at 0.040 BTC and the bulls couldn’t push the price above the channel. Looking at the chart, if the market continues to drop, the next key supports may likely be at 0.034 BTC and below.
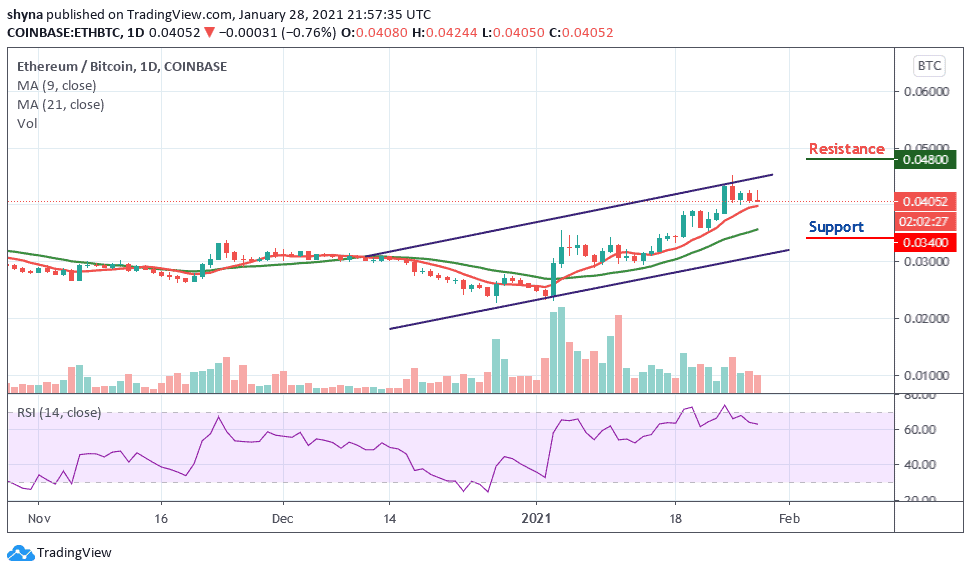
However, on the upside, a possible bullish movement may likely push the market above the ascending channel, when this is done, the resistance level of 0.048 BTC and above may be visited. The technical indicator RSI (14) is dropping below the 65-level and this is to indicate that the market may continue to fall as long as it faces down.
Join Our Telegram channel to stay up to date on breaking news coverage