Join Our Telegram channel to stay up to date on breaking news coverage
ETH Price Prediction – December 25
Ethereum (ETH) is in the process of recovering from the recent lows as it is currently attempting to break above $600.
ETH/USD Market
Key Levels:
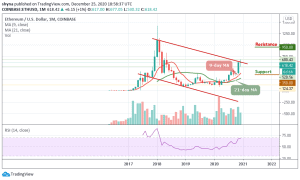
Resistance levels: $950, $1000, $1050
Support levels: $350, $300, $250
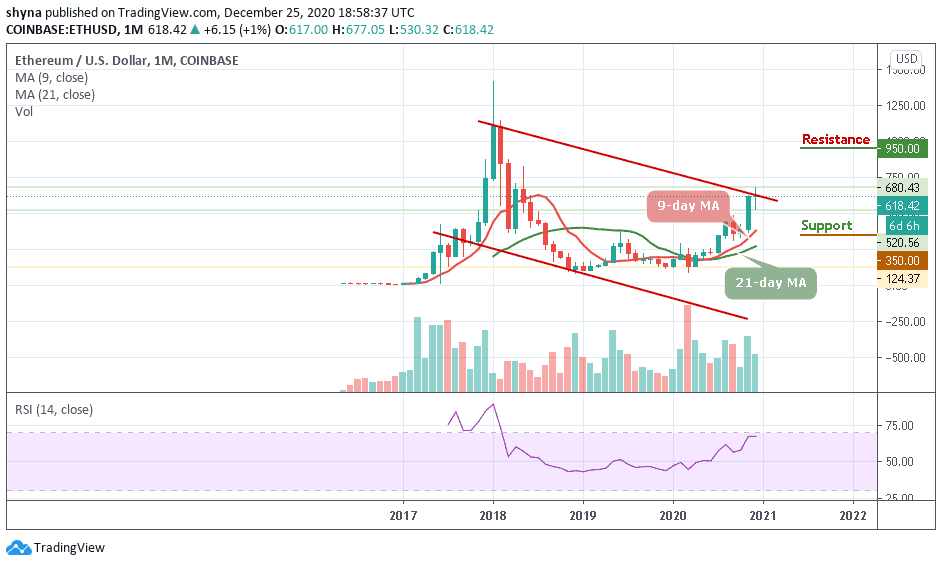
At the time of writing, ETH/USD is trading up with a 1% gain at its current price of $618, which marks a notable climb from its recent low of $530 that was set in the early trading session of today. The buying pressure here is quite intense, and whether it can climb higher or not will depend on its reaction to $650.
What is the Next Direction for Ethereum
Ethereum opened this year 2020 with the opening price of $128 and at the time of writing, the coin is trading around the $618 resistance level as it has made a tremendous bullish movement during and towards the end of the year 2020. Meanwhile, A rejection at the current level could spell trouble for its on-going upswing, whereas a rally above $680 could allow the coin to see a significant further upside towards the resistance levels of $950, $1000, and $1050.
Moreover, as the technical indicator RSI (14) remains below 70-level, the nearest support is located around the $500 level. If there is a bearish break below this support, ETH/USD could test the $400 support. The next major support is near the $350 level, where the bulls are likely to take a strong stand. Any further losses could lead the price towards the $300 and $250 support levels.
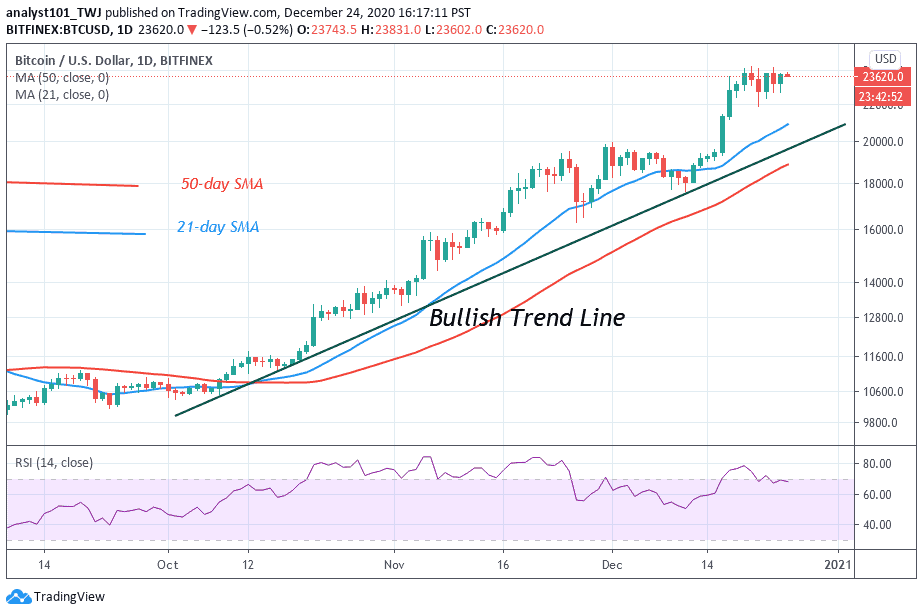
Against Bitcoin, in the coming year 2021, the Ethereum (ETH) may continue to follow the bearish movement in as much as the market value remains within the downside. Meanwhile, if the 9-day moving Average stays above the 21-day moving average, ETH/BTC may experience a bullish momentum; and this could take the coin to the resistance level of 0.050 BTC and above.

However, the technical indicator RSI (14) is revealed moving below 50-level giving a slight bearish confirmation. More so, any further bearish movement below the channel may locate the critical supports at 0.0450 BTC and below.
Join Our Telegram channel to stay up to date on breaking news coverage