Join Our Telegram channel to stay up to date on breaking news coverage
ETH Price Prediction – November 29
The price of Ethereum looks unstoppable, gaining a lot of market dominance over BTC.
ETH/USD Market
Key Levels:
Resistance levels: $640, $660, $680
Support levels: $480, $460, $440
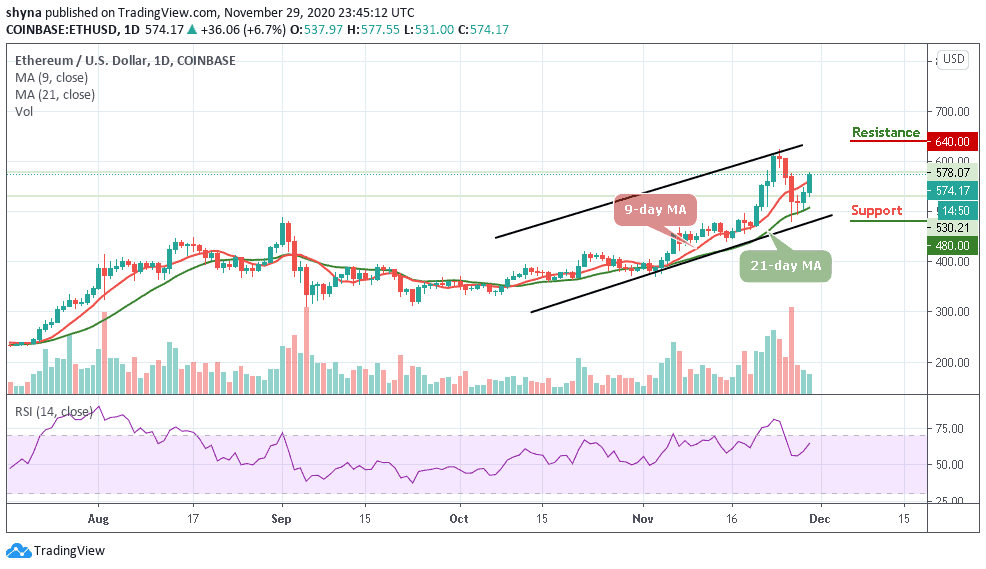
ETH/USD is seen trading at $574 after recording an intraday high at $577 today. The Ethereum (ETH) is gaining over 6.7% since the beginning of the day and it is changing hands above the 9-day and 21-day moving averages amid strong bullish bias. However, the bulls seem to have hit a pause button, for the time being, ETH/USD may be poised for a stronger recovery as several key technical levels are left behind.
What to Expect from Ethereum (ETH)
The price of Ethereum could rise above the $600 resistance level in the next few days as the on-going trend may move a little bit higher in the coming days. The Ethereum price may cross above the upper boundary of the channel to touch the potential resistance levels at $640, $660, and $680 respectively.
Meanwhile, should the technical indicator decide to make a quick turn from the above 60-level, the market price may likely slide below the moving averages for corrections. If the bulls fail to hold the $495 support, the further bearish drop could roll the market down to the support levels of $480, $460, and $440 respectively.
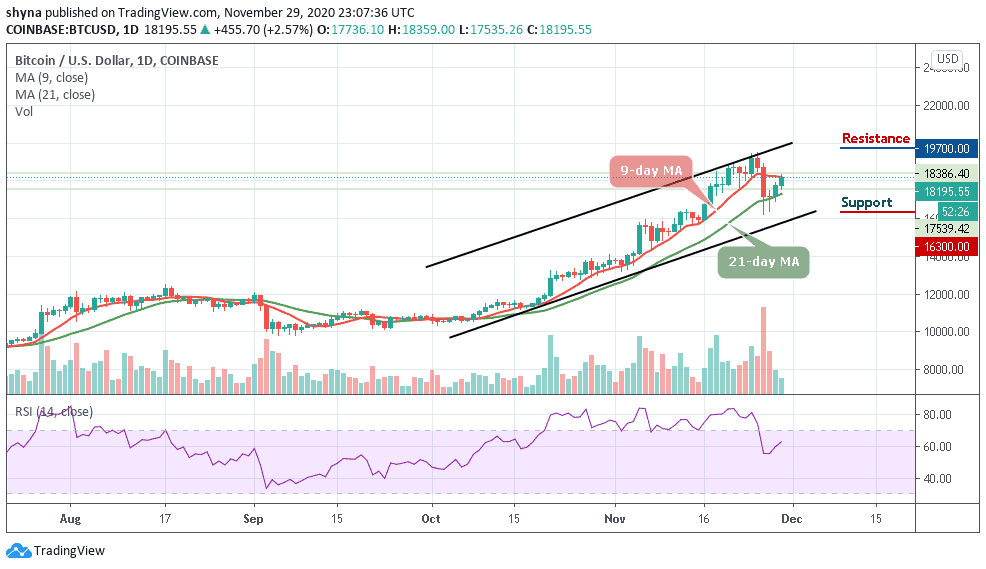
When compares against Bitcoin, as the red-line of the 9-day moving average remains above the green-line of the 21-day moving average, the market price may continue to follow the uptrend within the channel. Meanwhile, ETH/BTC is currently trading at the 3158 SAT and any bullish cross above the upper boundary of the channel could locate the key resistance level at 3400 SAT and above.
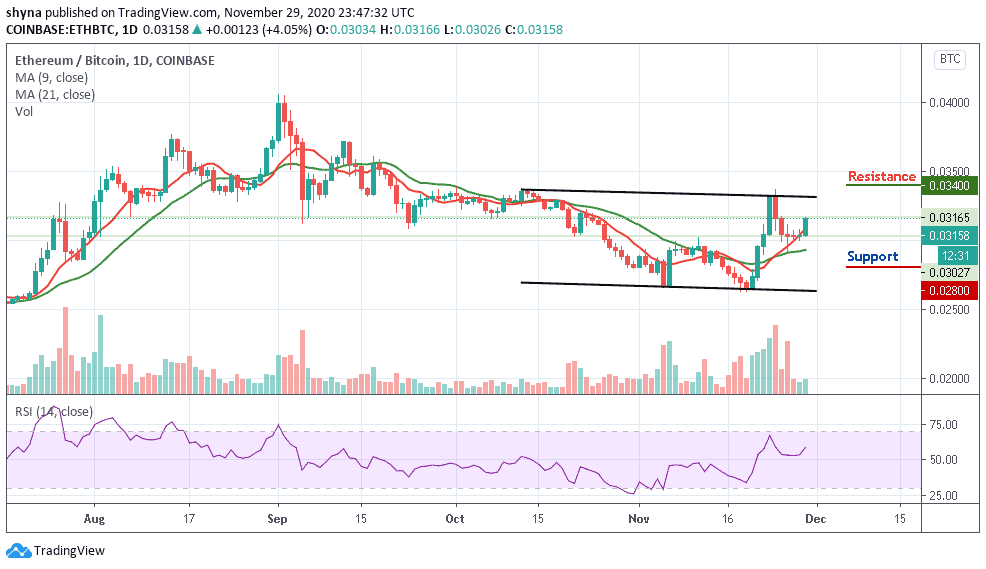
However, on the downside, a possible bearish movement below the moving averages may likely come into focus, immediately after this is done, the support level of 2800 SAT and below could be visited. Meanwhile, the market may continue to have a bullish day today because the technical indicator RSI (14) is facing the north, suggesting more bullish signals.
Join Our Telegram channel to stay up to date on breaking news coverage