Join Our Telegram channel to stay up to date on breaking news coverage
Bitcoin (BTC) Price Prediction – November 29
The Bitcoin (BTC) is seen showing some strength after a critical correction to the support of $16,200 in the last few days.
BTC/USD Long-term Trend: Bullish (Daily Chart)
Key levels:
Resistance Levels: $19,700, $19,900, $20,100
Support Levels: $16,300, $16,100, $15,900
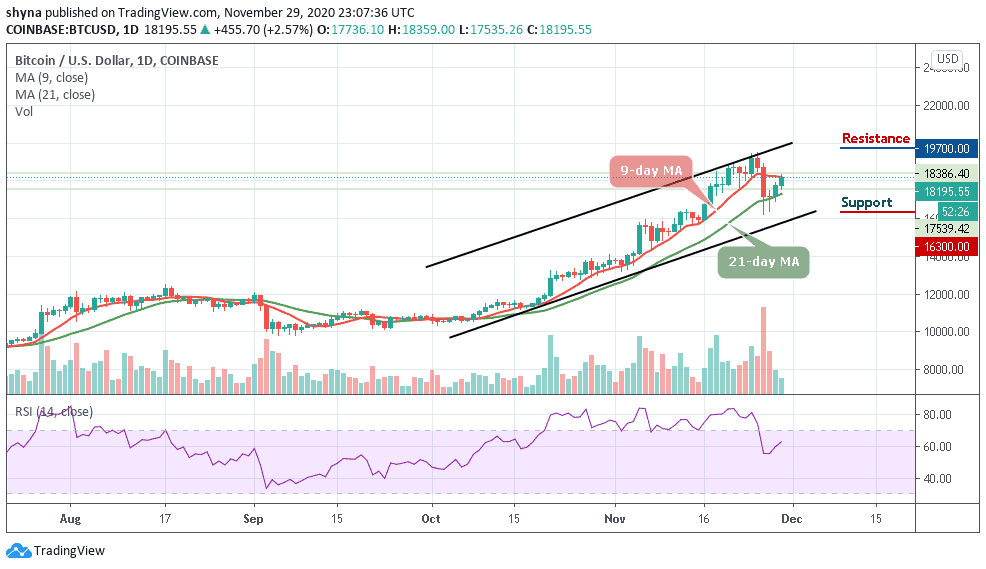
BTC/USD is currently pushing higher, with bulls moving to erase the losses that came about as a result of the recent sell-off. Over the past few days, the Bitcoin price action has done little to provide traders with insight into where the entire market will trend next. After rallying up to its all-time highs of around $19,500, the cryptocurrency faced a firm rejection that caused it to reel as low as $16,200 on November 26.
Would Bitcoin Go Up or Down?
At the time of writing, Bitcoin is trading up just under 2.57% at its current price of $18,195, which marks a notable rise from its recent lows of $16,200 set at the bottom of the recent market-wide sell-off. Where Bitcoin trends in the days and weeks ahead should depend largely on whether or not it can gain a solid foothold within the lower $18,000 region. If it can, BTC/USD may be on the cusp of seeing a strong move higher towards the resistance levels of $19,700, $19,900, and $20,100 as the technical indicator RSI (14) moves above the 60-level.
However, the first digital asset is now trading back above $18,000 and isn’t showing signs of slowing down. Therefore, if this level becomes a base of support, BTC/USD could allow for significant further growth in the days ahead, and for the current uptrend to persist, it must hold above the $17,500 level. A break below this level could open the gates for a move down towards the supports of $16,300, $16,100, and $15,900 respectively.
BTC/USD Medium-Term Trend: Bullish (4H Chart)
The 4-hour chart reveals that the bulls are having their say in the market movement. But as it is now, the movement above the 9-day and 21-day moving averages shows that there are confidence and liquidity in bulls to take the Bitcoin price forward today.
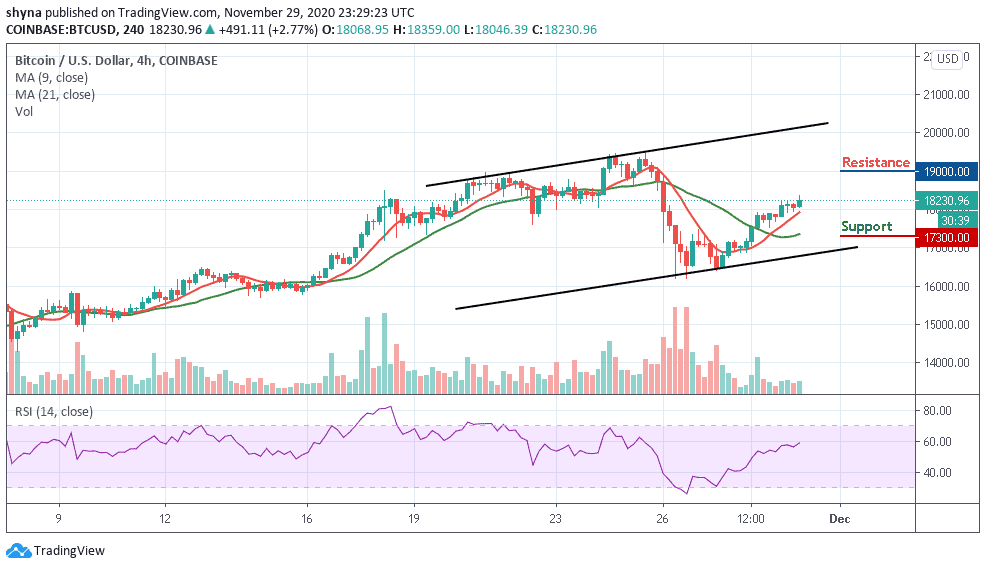
However, if the current bullish move falters, the bears may bring the price down to the support level of $17,300 and below. But if the market price rises towards the upper boundary of the channel, it may reach the resistance levels of $19,000 and above as the RSI (14) is about to cross above 60-level.
Join Our Telegram channel to stay up to date on breaking news coverage