Join Our Telegram channel to stay up to date on breaking news coverage
ETH Price Prediction – November 18
ETH/USD is recovering from the slump; strong resistance may be created by the intraday high of $495.
ETH/USD Market
Key Levels:
Resistance levels: $510, $520, $530
Support levels: $440, $430, $420
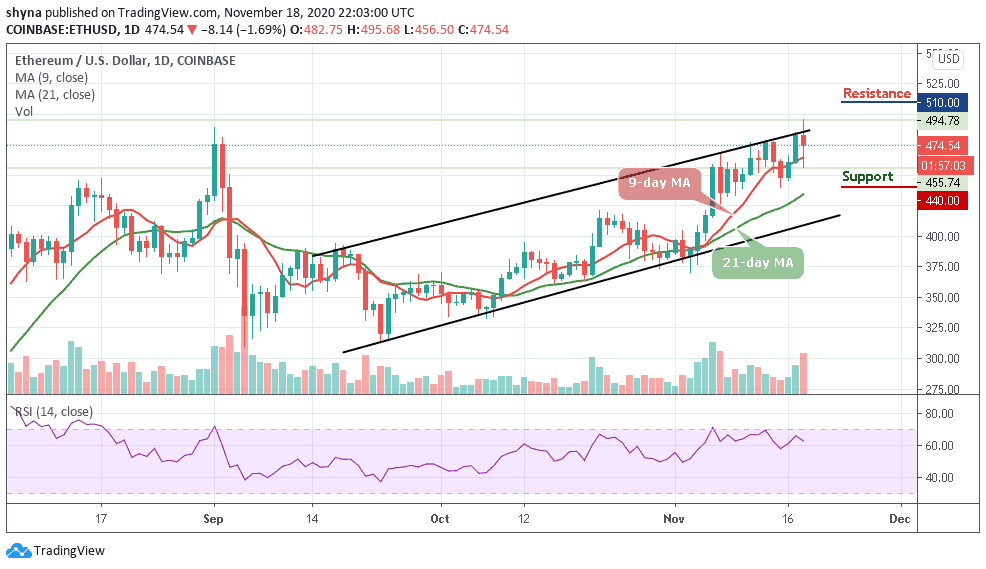
At the time of writing, ETH/USD is changing hands at $474. The second digital coin with its current market value drops below $490 after touching the daily high but the coin still managed to regain the ground amid technical correction. Moreover, the coin is down with a 1.69% loss since the beginning of the day.
Where is ETH Price Going Next?
On the daily chart, the technical indicator RSI (14) is showing that the bears are making a noticeable effort considering that the price dived to $456 during the Asian hours. Meanwhile, the market movement suggests that the bearish exhaustion is coming up gradually. However, the recovery above the 70-level followed by a continued movement above the 9-day and 21-day moving averages would stir up more bullish action.
Meanwhile, if the bears continue to bring down the price below the moving average, the immediate support may be located at $450 which is below the 9-day MA. Further bearish movement below this level may hit the critical supports at $440, $430, and $27. But if the buyers continue to push the market higher, the immediate resistance above $420 support levels. Therefore, any bullish movement above the upper boundary of the channel could touch the resistance levels at $510, $520, and $530.
Comparing ETH with BTC, the pair has been following the downward trend below the 9-day and 21-day moving averages as the bears are still in charge of the market. ETH/BTC is now trading at 0.0266 BTC as the bulls couldn’t push the price to the north. On other hand, if the price crosses above the moving averages, the next key resistance may be at 0.0295 BTC and above.
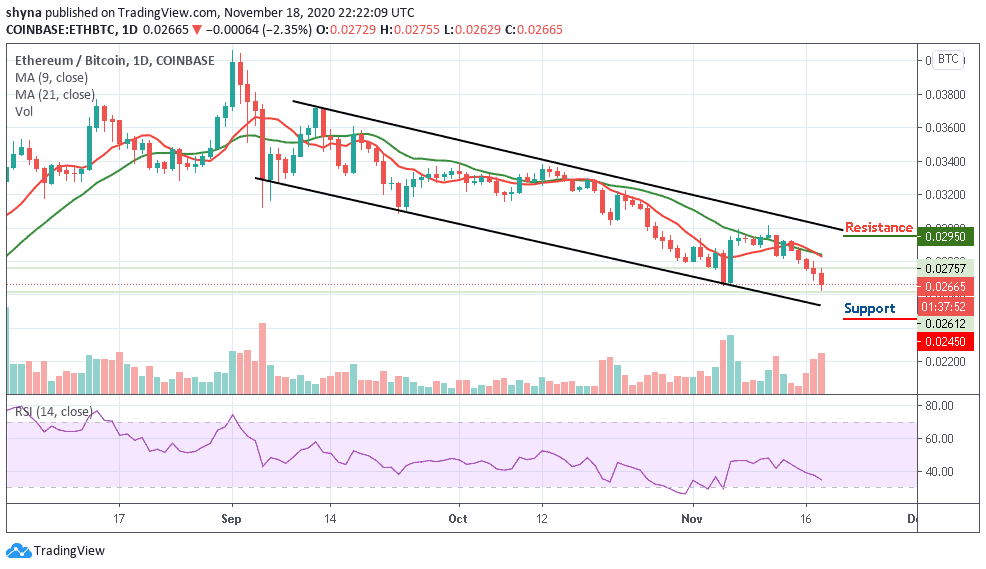
Nevertheless, should in case the bears continue with the downward trend, 0.0245 BTC and below may play out. The technical indicator RSI (14) is heading towards the oversold zone, which suggests more bearish signals.
Join Our Telegram channel to stay up to date on breaking news coverage