Join Our Telegram channel to stay up to date on breaking news coverage
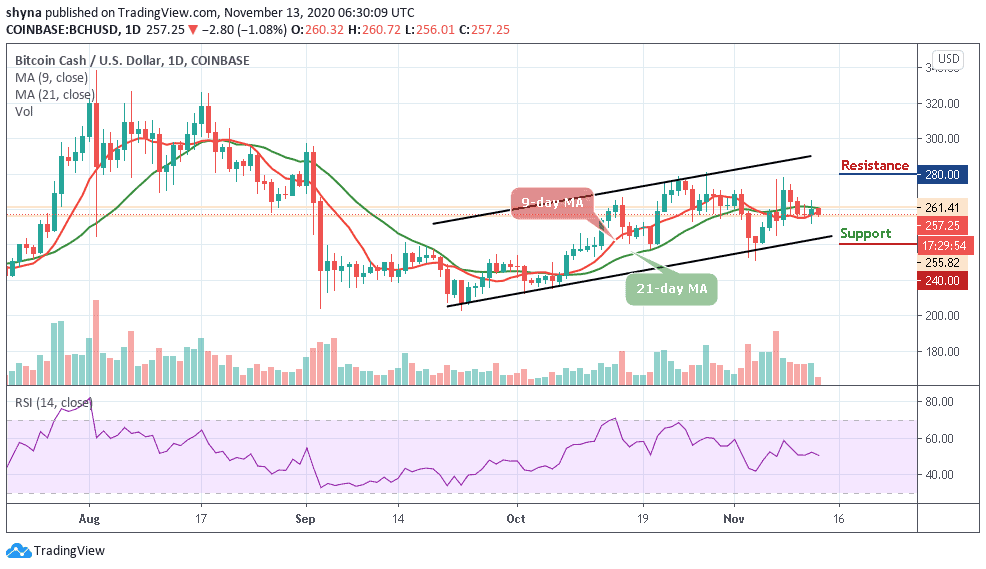
ETH Price Prediction – November 13
The Ethereum (ETH) is approaching a crucial support level, similar to Bitcoin. The coin must hold the $460 support to climb towards $480.
ETH/USD Market
Key Levels:
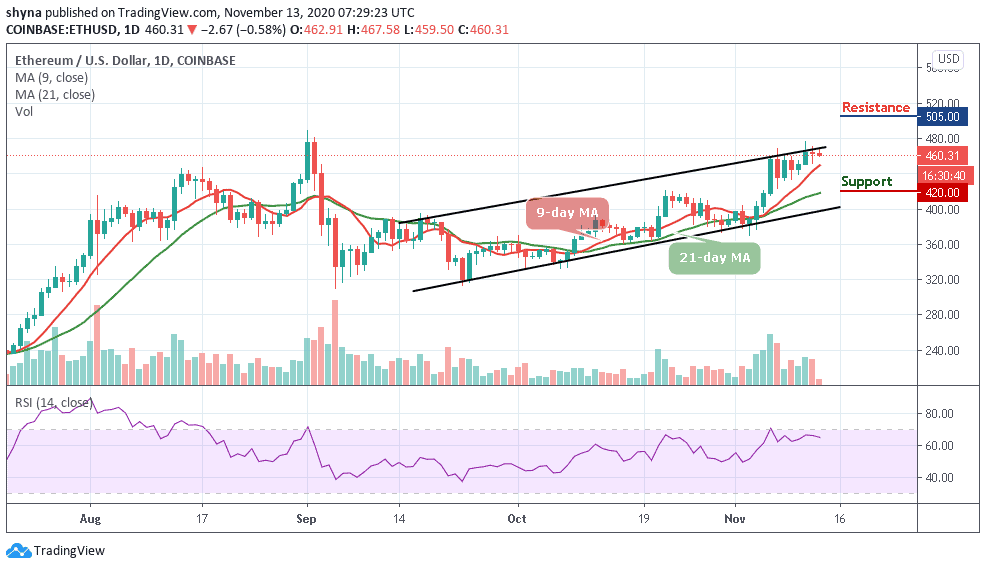
Resistance levels: $505, $515, $525
Support levels: $420, $410, $400
At the moment, ETH/USD is hovering at $460 following 0.58% loss at the opening of the market today. The market is in the red, with most cryptos having succumbed to downward pressure at the time of writing. Bitcoin (BTC), for example, is inching closer to $16,200 support after failing to hold above $16,400. There is a possibility of retracement towards $16,000 before the largest crypto gathers the strength to zoom towards the coveted $17,000.
Where is ETH Price Going Next?
Ethereum’s immediate upside is limited by the upper boundary of the channel currently at $460.31. Marginally below this, the daily high at $457 may continue to give the buyers sleepless nights. However, a break above the resistance level of $467 could most likely give ETH/USD a boost above $480 before reaching the important resistance at $505, $515, and $525 levels.
On the downside, the RSI (14) signal line may soon be retreating from highs around the 65-level. If the first support at $450 around the 9-day moving average failed to hold the downtrend, Ethereum could revisit $433 support. Meanwhile, the critical support levels to keep eye on are $420, $410, and $400 which are below the 21-day moving average.
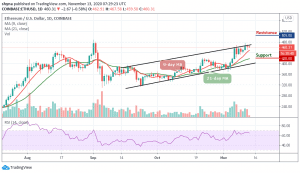
Comparing with Bitcoin, we can see that Ethereum is clearly bearish. As the price falls, sellers are posing an additional threat for buyers to reach the support level of 0.0280 BTC where the nearest target is located. However, an eventual break below the channel may cause Ethereum to collapse.

Meanwhile, the continuation of the downtrend could hit the main support at 0.0270 BTC before falling to 0.0260 BTC and below. More so, the buyers may likely push the market above the 9-day and 21-day moving averages to hit the potential resistance at 0.0310 BTC and above if a rebound plays out. The RSI (14) is moving above the 40-level, indicating a sideways movement.
Join Our Telegram channel to stay up to date on breaking news coverage