Join Our Telegram channel to stay up to date on breaking news coverage
BCH Price Prediction – November 13
The Bitcoin Cash (BCH) is trading in the red, with losses of 1.08% as reveals by the daily chart.
BCH/USD Market
Key Levels:
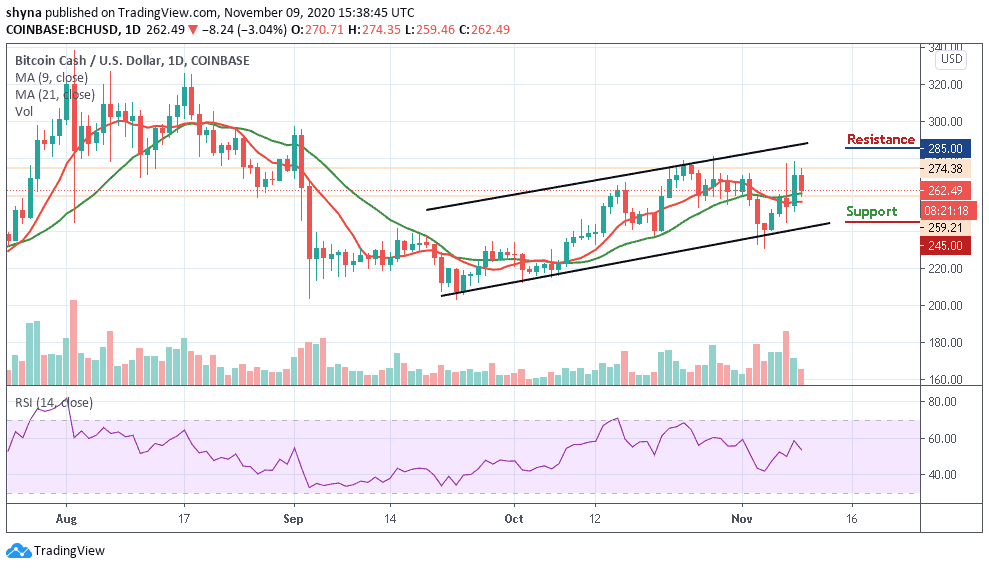
Resistance levels: $280, $290, $300
Support levels: $240, $230, $220
BCH/USD has adjusted lower from $260.32 which is the opening value to trade at $257.25. An attempt to pull upwards has been capped under $260 with $260.72 being the intraday high achieved so far. However, the Bitcoin Cash price upside is limited under $250 as well as the lower boundary of the channel. The path of the least resistance remains to the north amid growing selling activities.
Would Bitcoin Cash Go Up or Down?
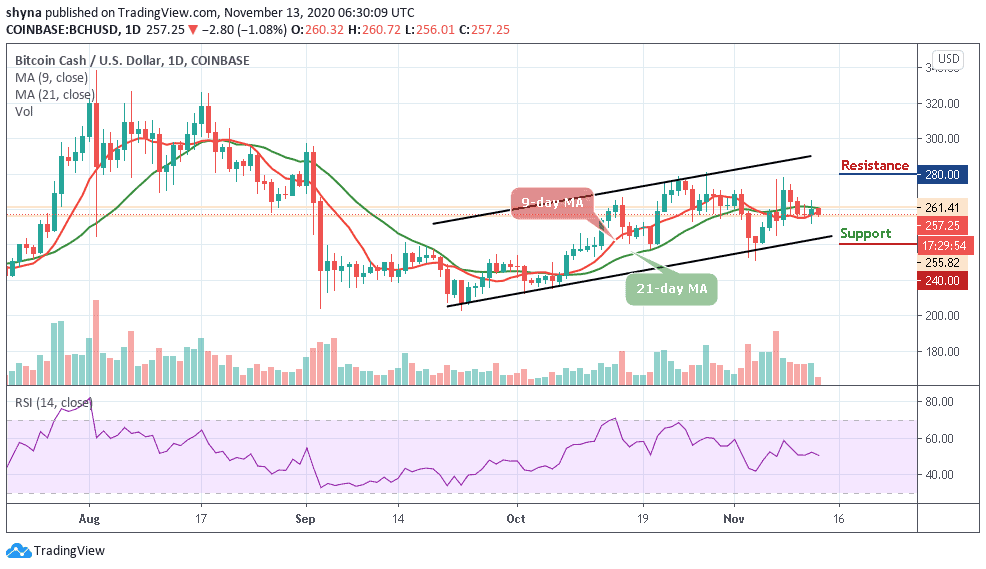
Bitcoin Cash failed to break above the 9-day and 21-day moving averages in order to move to the upside, the market price has been having a bearish inclination since the past few days. However, it is an uphill task for the coin to sustain the gains above the critical $265 due to the renewed bearish momentum emanating from the rejection around $260.
Nevertheless, if the market drives below the $250 support, BCH price could slump to $240, $230, and $220 support levels, bringing the price to a new low as the RSI (14) prepares to cross below the 50-level. Meanwhile, a strong buying pressure may take the price to $270 resistance. While trading at this level, a bullish continuation may likely push the price to hit the resistance levels of $280, $290, and $300.
When compares with BTC, the BCH market has been following the downtrend. But currently, the sellers are gaining control of the market as they move below the 9-day and 21-day moving averages around the lower boundary of the channel while the RSI (14) moves into the oversold region, indicating more bearish signals.
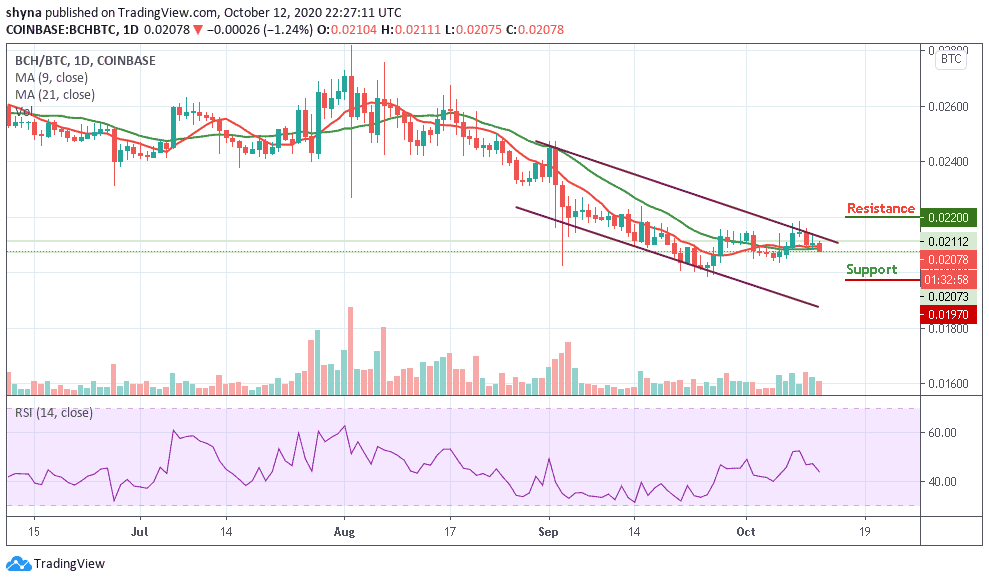
Moreover, the bears are putting more pressure on the market to increase their entries. More so, if the bears succeeded in breaking below the channel, one would expect the market to fall to the support level of 0.014 BTC and 0.013 BTC. In other words, a rebound could increase the price to the resistance level of 0.018 BTC and 0.019 BTC respectively.
Join Our Telegram channel to stay up to date on breaking news coverage