Join Our Telegram channel to stay up to date on breaking news coverage
ETH Price Prediction – November 4
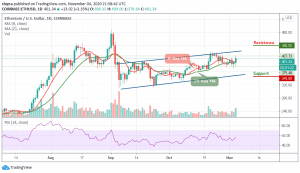
The Ethereum steady bullish action is breaking above the $400 barrier; although, eyes currently glued on $410.
ETH/USD Market
Key Levels:
Resistance levels: $440, $450, $460
Support levels: $345, $335, $325

ETH/USD is seen refreshing to a new high after touching the daily low of $376 to breaches above $405 while currently trades at $401 with a bullish crossover and trend in the intraday. At the time of writing, ETH/USD has adjusted to $409. Higher support at $400 is expected to be a stepping stone for a comeback past $420 and the majestic rally eyeing $430 resistance level.
Where is ETH Price Going Next?
For Ethereum, parallel trade can only take over if the $400 subsidy is maintained at all costs. Currently, the technical indicator RSI (14) is about to cross above the 60-level at the moment by sending the bullish signals which can finally encourage more buyers to enter the market.
Meanwhile, in as much as the red-line of 9-day MA moves above the green-line of 21-day MA, the coin may continue to do well and the price could hit the resistance levels at $440, $450, and $460 respectively. More so, if the technical indicator decides to make a quick turn back to the lower side, then, there may be a quick bearish drop which may likely roll the market down to the support levels of $345, $335, and $325.
Against BTC, Ethereum is trading towards the 9-day moving average and the price is now hovering at 0.028 SAT as the technical indicator RSI (14) escapes from the oversold region. For the fact that the bears remain the dominant of the market, the pair seems to be moving towards both 9-day and 21-day.
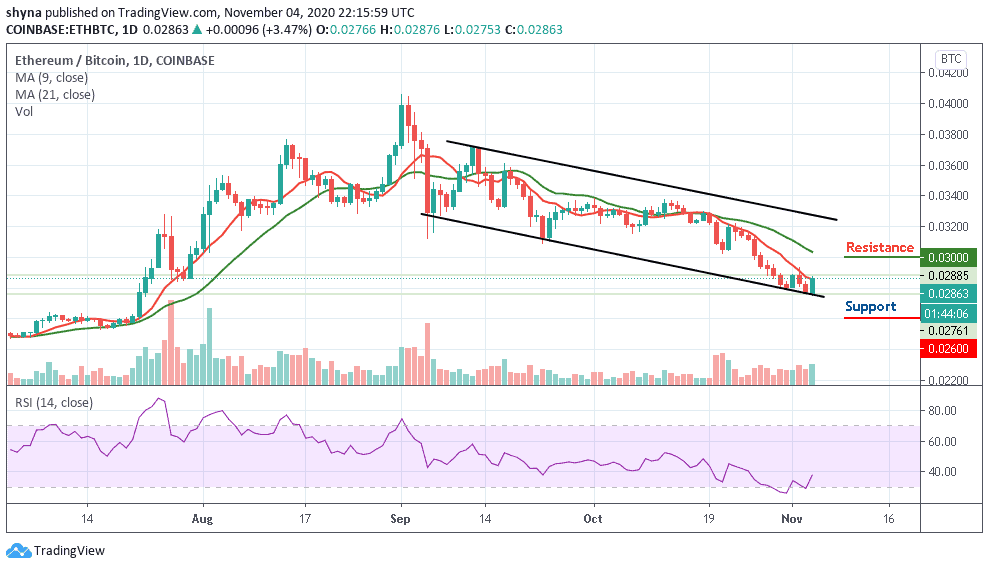
Moreover, the resistance levels to be reached are 3000 SAT and 3200 SAT. In other words, a higher sustainable move may likely cancel the bullish pattern and this could attract new buyers coming into the market with the next focus on 3000 SAT and 3200 SAT support levels.
Join Our Telegram channel to stay up to date on breaking news coverage