Join Our Telegram channel to stay up to date on breaking news coverage
ETH Price Prediction – November 2
Today, Ethereum is seen losing more than 3.45% to go as low as $382; the next support may come at $365.
ETH/USD Market
Key Levels:
Resistance levels: $440, $450, $460
Support levels: $345, $335, $325
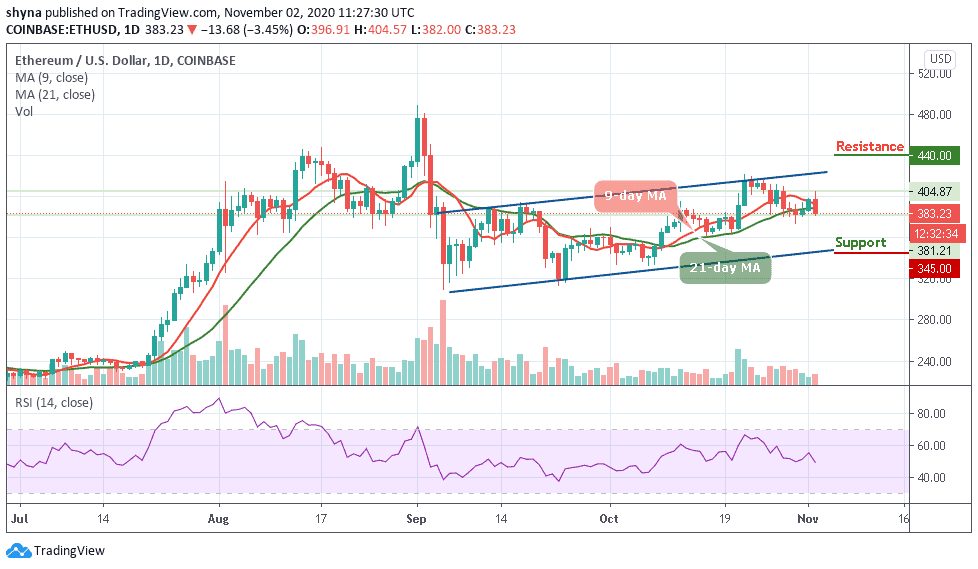
ETH/USD is moving in a downward trend from the recent high that reached $404 since the beginning of the trading today. At the time of writing, ETH/USD is hovering around $383.23. This amount has been fluctuating since the beginning of the day and now trading down below the 9-day and 21-day moving averages.
What to Expect from Ethereum (ETH)
Considering the market condition, ETH/USD trading activity has been quite inactive. In fact, the volatility is low. However, the market is positioned in a downtrend. Meanwhile, this reflects the selling dominance as the price keeps falling. As buyers struggle to defend their positions, sellers keep dragging the price down to retain the price lower. However, if the coin falls below $360, ETH/USD may continue to show low prices and fall to the support levels of $345, $335, and $325.
Moreover, the Ethereum price seems to be ready for the downside as the 9-day MA is ready to cross below the 21-day MA while the technical indicator RSI (14) confirms this as the signal line moves below 55-level. Meanwhile, until the market finds a stable level to reinforce the uptrend, ETH/USD may continue with the downtrend, else, it may find a resistance level at $400 while other resistance levels lie at $440, $450, and $460 respectively.
When compares with BTC, on the structural outlook, the pair is descending as confirmed by the 9-day moving average; trending below the daily high of 2935 SAT. For the past four weeks, the price of Ethereum against Bitcoin has been experiencing a serious downward movement. But should it move inversely to the lower side of the channel, the closest supports are at 0.0260 BTC and below.
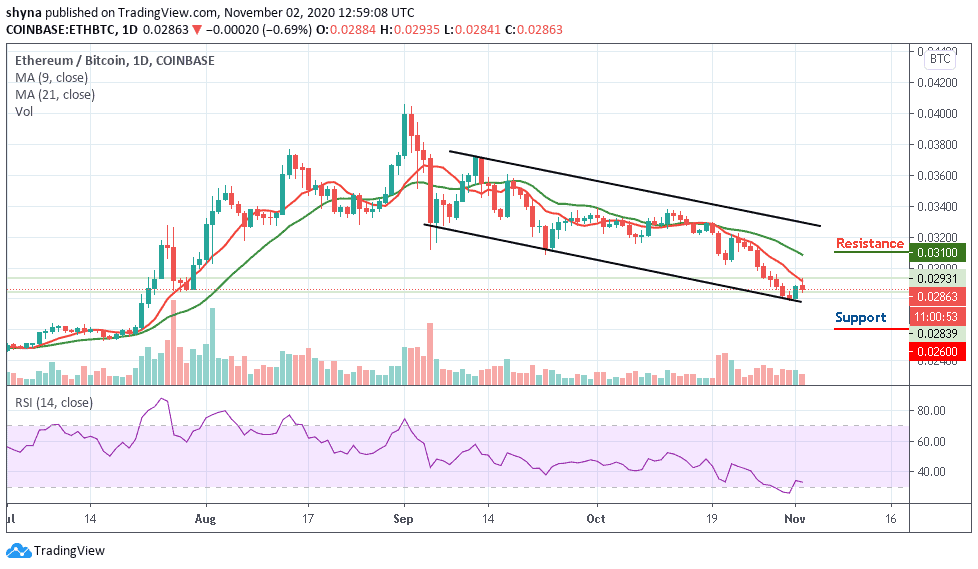
However, the technical indicator RSI (14) has just moved away from the oversold region which could indicate a gradual return of the bulls. Meanwhile, it will need to push above the moving averages for ETH to go higher against BTC. Any further bullish movement may hit the potential resistance levels at 0.031 BTC and above.
Join Our Telegram channel to stay up to date on breaking news coverage