Join Our Telegram channel to stay up to date on breaking news coverage
Bitcoin (BTC) Price Prediction – November 1, 2020
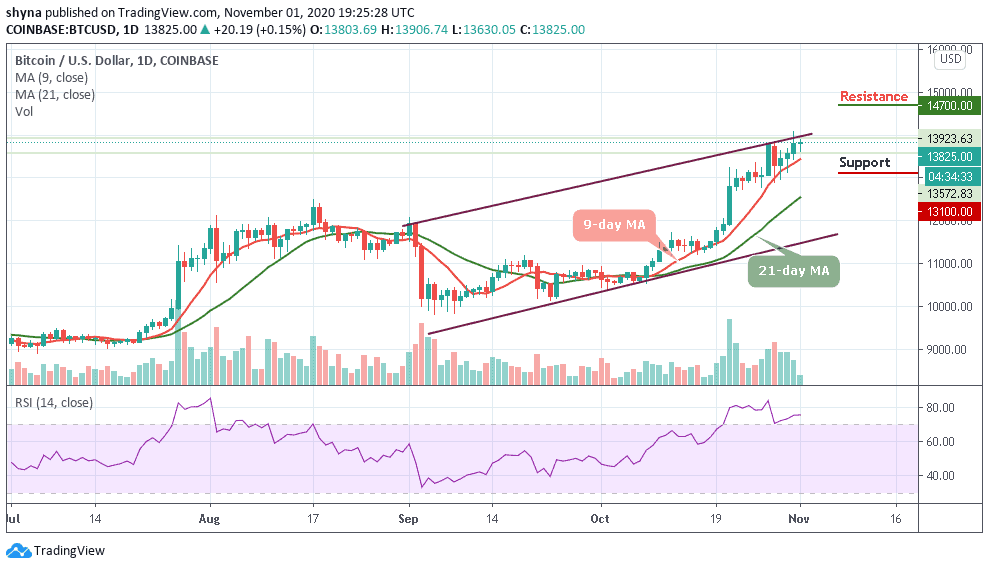
After retesting the $14,000 resistance, BTC/USD was compelled to a range-bound movement between $13,600 and $14,000. For the past two days, BTC has been fluctuating in the current price range.
Resistance Levels: $13,000, $14,000, $15,000
Support Levels: $7,000, $6,000, $5,000
Soon after the retest at the $14,000 resistance on October 31, Bitcoin bulls have not been able to retest or break the current resistance. Rather, the price has been fluctuating between $13,600 and $14,000. Buyers at a time have pushed BTC price above $13,973 but failed to sustain the uptrend. However, if the bulls fail to sustain above $14,000, and the bears break below the lower price range, BTC price will drop. This will suggest Bitcoin’s bullish momentum is weakened.
The king coin is currently fluctuating between the current price range. For example, if Bitcoin bounces above $13,800 support, the momentum will rise and break the $14,000 resistance. The bullish momentum will extend to the previous highs. In the meantime, BTC is trading at $13,838 at the time of writing. The coin is stuck between $13,600 and $14,000. The crypto is still trading in the overbought region above the 80% range of the daily stochastic.
The Term “Hash Rate” Is Coined by a Company Which is Not Concerned About Its Recent Decline
The term “Hash Rate” was coined by Garrick Hileman, the head of research at Blockchain .com.Bitcoin hash rate has declined during the year but the price remains unaffected. Blockchain .com was founded in 2011. The company coined the term “hash rate” as a metric that “estimates [the] number of terahashes per second, the Bitcoin network is performing.” It is assumed that the Bitcoin hash rate tends to be highly volatile. This year it has dropped to the lowest point, that is 76 million TH/s, on March 25 but later it went up again.
It went up following Bitcoin’s most recent block halving. In an interview; Hileman indicated that he didn’t see the recent decline as a cause for concern. He said the following: “The hash rate is substantially higher than it was following the halving in May. So for me, it’s not registering as a major concern. It is an interesting data point. But we’ve seen other dips since the halving that in terms of percentage drops look roughly similar. So it may just be noise or something that is not that significant, but it’s something to monitor for sure.”
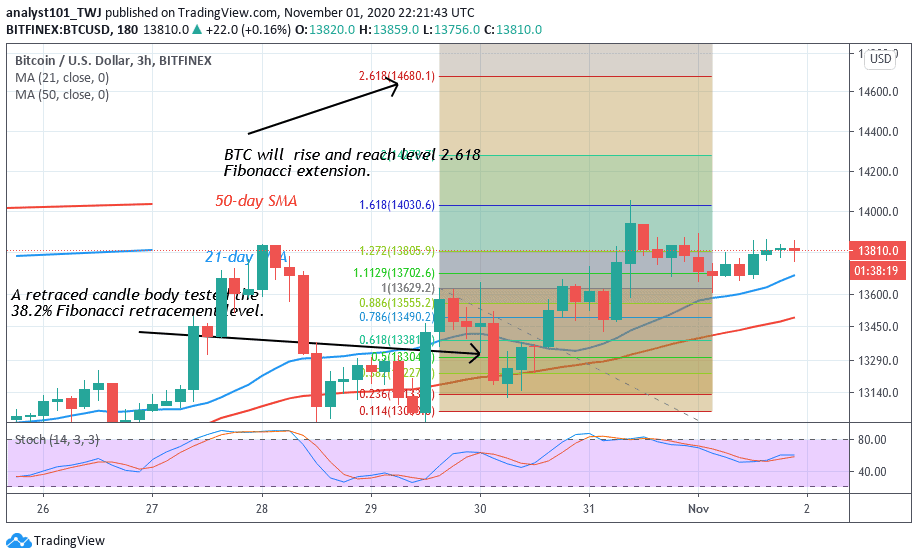
Meanwhile, Bitcoin is trading in a price range. A breakout will propel the coin to rally above the current resistance. On October 29 uptrend, BTC was resisted. The retraced candle body tested the 38.2% Fibonacci retracement level. This implies that the market will rise and reach a level of 2.618 Fibonacci extensions.
Join Our Telegram channel to stay up to date on breaking news coverage