Join Our Telegram channel to stay up to date on breaking news coverage
ETH Price Prediction – August 26
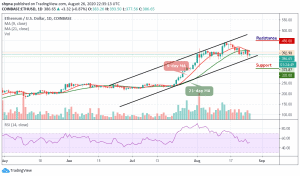
In the past few days, Ethereum surges from $447 and dropped to a low of $369.
ETH/USD Market
Key Levels:
Resistance levels: $450, $455, $460
Support levels: $320, $315, $310
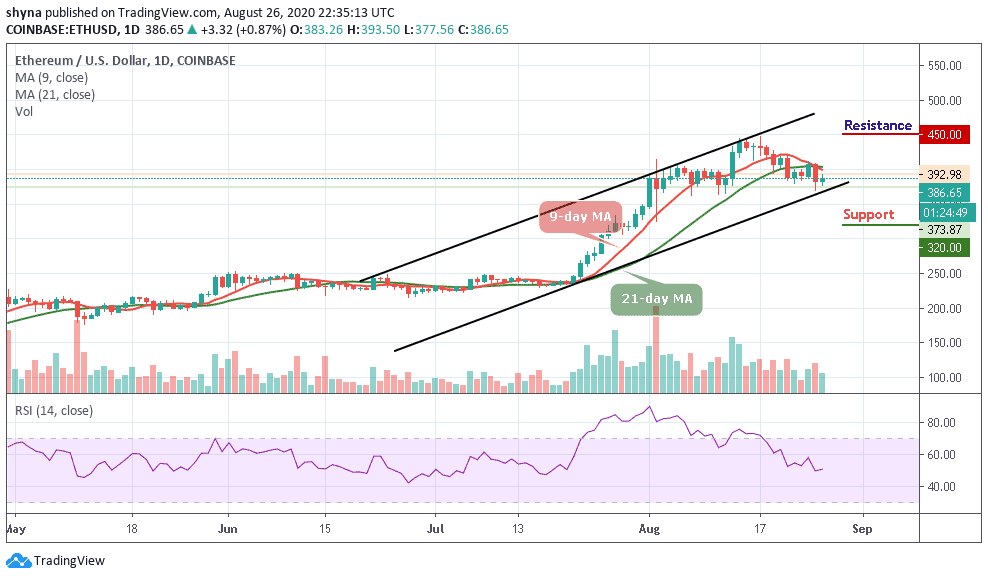
ETH/USD is seen consolidating within the ascending channel for the past few days. For now, ETH/USD is currently trading at $386.65 below the 9-day and 21-day moving averages. At the opening of the market today, the daily chart shows that the price first went up to $392.98, where it met resistance and later fell to $373.87 support level where it began to correct itself.
What is the Next for Ethereum (ETH)?
The bulls have regained control of the market. Early this month, trading has been a resounding victory for the bulls as Ethereum’s price jumped up, breaking above the 9-day and 21-day moving averages and touching the high of $447. Looking at the daily chart, the daily breakdown shows us that ETH/USD may begin to follow the downward trend if the 9-day MA crosses below the 21-day MA.
However, for a backward movement, the market may be supported by $320 and $315 levels, if the price falls below the previous levels; another support is around $310. But should in case the price exceeds the indicated level by breaking above the moving averages, the resistance levels of $450, $455, and $460 may be visited. The RSI (14) signal line is moving around the 51.41-level.
Against BTC, Ethereum continued to follow the bearish sentiment as the price is already moving below the 9-day and 21-day moving averages. Presently, the coin is suffering from strong selling power. If the bulls failed to move the coin higher, the bears may continue to release huge pressure on the market.
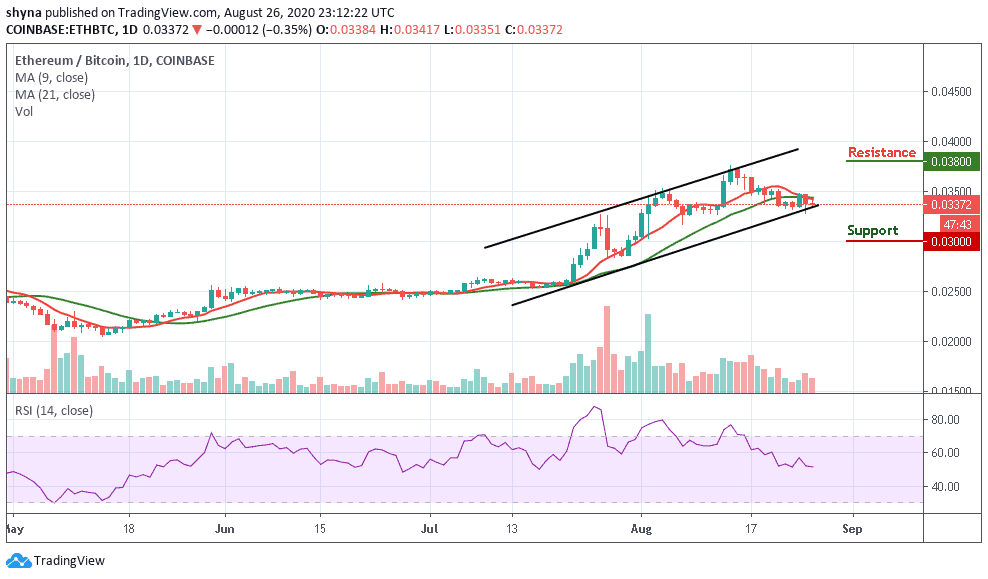
However, the bearish scenario might rally further to 3000 SAT and 2800 SAT support levels. However, if the bulls could manage and hold the support at this level, an upward movement to the 3800 SAT and potentially 4000 SAT resistance levels may likely surface. But a glance at the current market suggests a sideways movement for the market.
Join Our Telegram channel to stay up to date on breaking news coverage