

Join Our Telegram channel to stay up to date on breaking news coverage
ETH Price Prediction – October 7
Ethereum (ETH) dives below the key supports and it may continue to move down towards $325 if it fails to stay above $335.
ETH/USD Market
Key Levels:
Resistance levels: $380, $400, $420
Support levels: $300, $280, $260
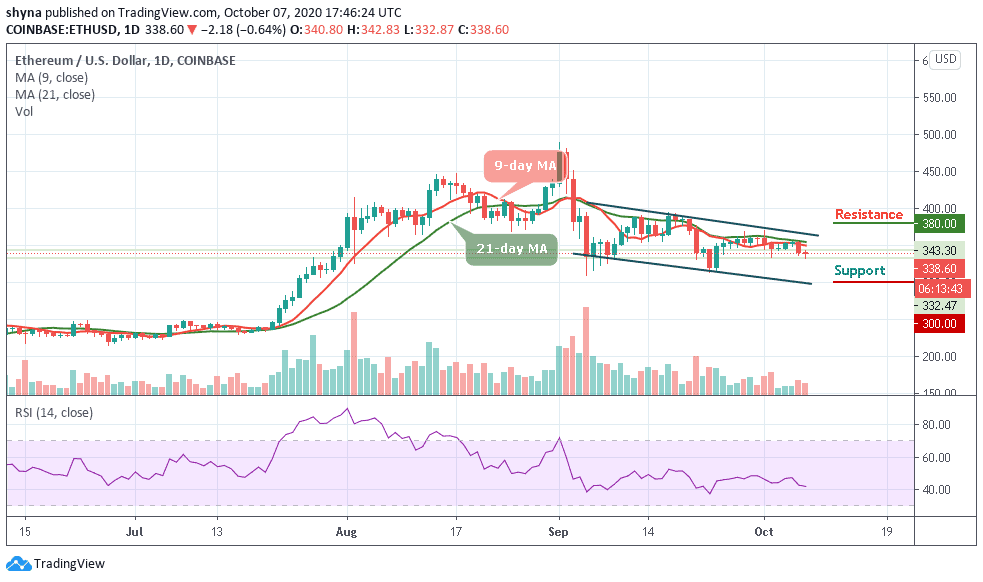
ETH/USD is seen retreating towards the $330 level at the time of writing. ETH coin just like any other altcoins including Bitcoin has been experiencing a grim movement against the US Dollar and over the past 24 hours it bottomed out close to major support at $332.
What to Expect from Ethereum (ETH)
ETH/USD is currently hovering below the 9-day and 21-day moving averages trying to recover from the intraday low. However, with a setback, Ethereum lowered to test supports around $332, while currently trades around $338, losing 0.64% of its value since the beginning of today and has remained virtually unchanged from day-to-day.
Nonetheless, the Ethereum price continues to follow the downtrend but still within the channel and any attempt to break below the channel may reach the nearest support at $300, $280, and $260 levels. Conversely, if the bulls push the price above the moving averages and maintain the upward movement above the channel, the buyers may find resistance at $380, $400, and $420.
In other words, the technical indicator is seen moving in the same direction above the 40-level, suggesting a possible sideways movement into the market.
Against Bitcoin, the market price remained in the ascending channel as the coin may begin to move in sideways. ETH/BTC is currently trading at the level of 0.032 BTC and the bulls couldn’t push the price above the 9-day and 21-day moving averages. Looking at the daily chart, if the market continues to drop, the next key supports may likely be at 0.030 BTC and below.
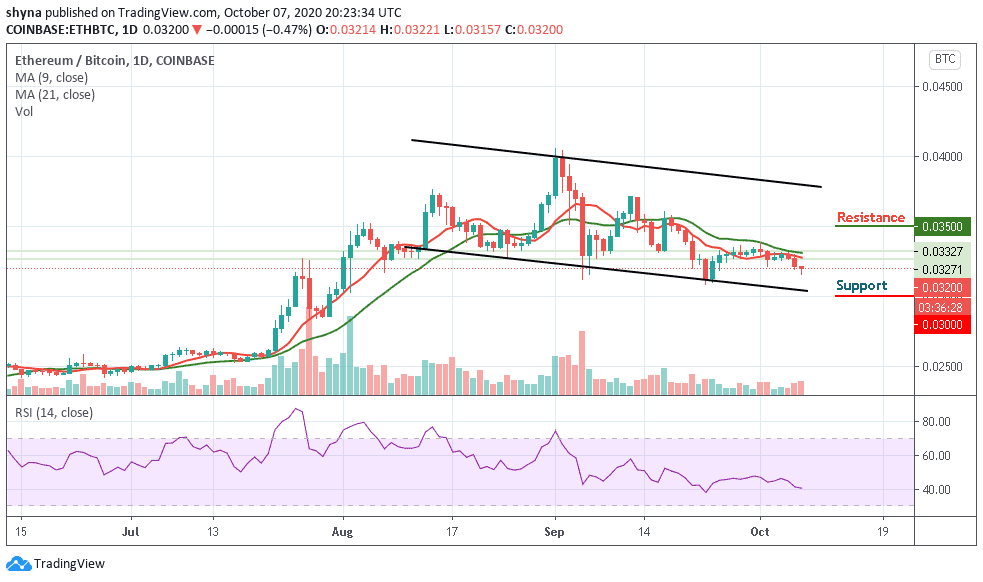
However, on the upside, a possible bullish movement above the moving averages, may hit the resistance level of 0.035 BTC and above may be visited. The stochastic RSI is still within the oversold zone and this indicates that the market may continue to fall.
Join Our Telegram channel to stay up to date on breaking news coverage
