Join Our Telegram channel to stay up to date on breaking news coverage
ETH Price Prediction – October 2
ETH/USD price is approaching a crucial support level, similar to Bitcoin. The Ethereum price must hold the $346 support to climb towards $350.
ETH/USD Market
Key Levels:
Resistance levels: $415, $420, $425
Support levels: $285, $280, $275
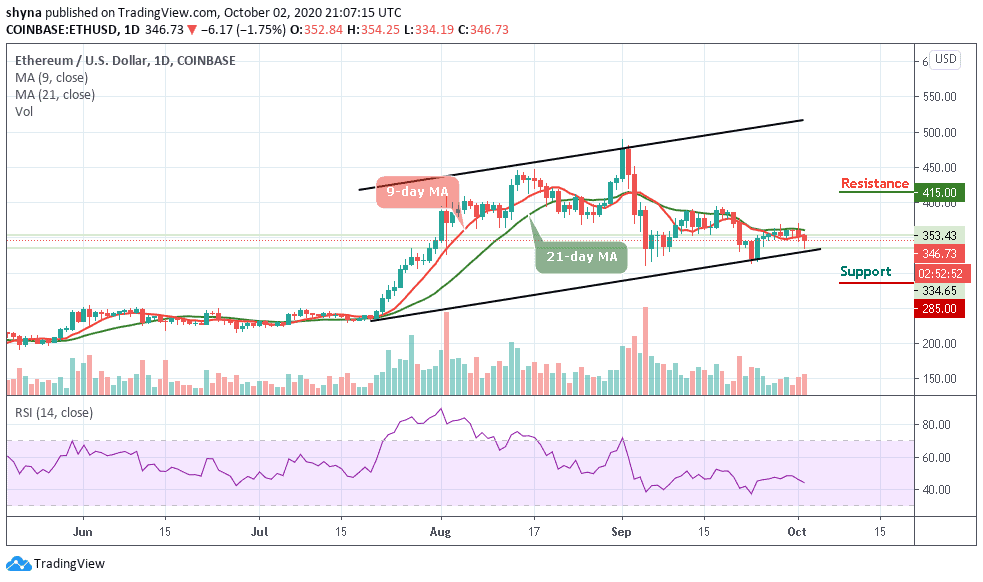
ETH/USD is trading down 1.75% at its current price of $346.73, which marks a notable decline from its daily highs of $354.25 that was set today when the bulls attempted to spark another rally. In the near-term, ETH/USD has been able to find some support in the lower $335 level, as it has bounced multiple times after visiting these levels.
Where is ETH Price Going Next?
Ethereum has been bitten today by the bear. ETH/USD is currently experiencing a price drop. Many traders were expecting a lot from the coin, although September 24 to 29 reflected an improvement in ETH prices. The price is currently moving under the 9-day and 21-day moving averages but changing hands at $346.73 which is yet to break out to the upside or downside of the channel.
Moreover, a bearish drop may continue to roll the market down to the support level of $285, $280, and $275 while a possible bullish surge may drive the market above the 9-day moving average to the $370 level, the $415, $420, and $425 may further provide resistance levels for the market. RSI (14) is facing the negative side and staying there would cause the coin to remain below the $350 support level.
Against Bitcoin, the market price remains within the descending channel as the bears continue to take over the market. ETH/BTC is currently trading at 0.328 BTC and the bulls couldn’t push the price to cross the 9-day and 21-day moving averages. Looking at the chart, if the market continues to drop, the next key supports may likely be at 0.0300 BTC and below.
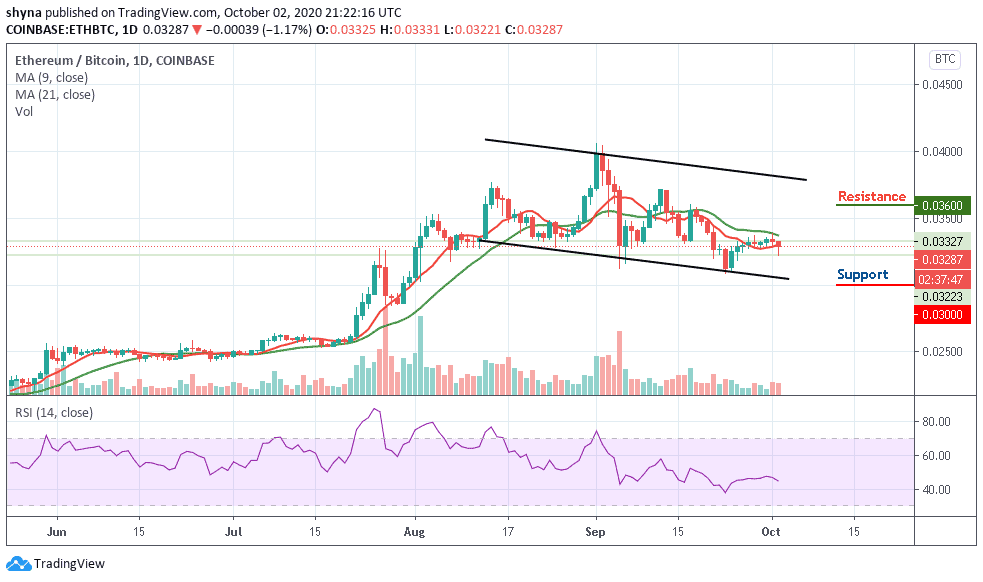
However, on the upside, a possible bullish movement may likely push the market above the moving averages, when this is done, the resistance level of 0.0360 BTC and above could be visited. The RSI (14) is trading below the average, suggesting that the market may continue to fall.
Join Our Telegram channel to stay up to date on breaking news coverage