Join Our Telegram channel to stay up to date on breaking news coverage
ETH has experienced a remarkable resurgence, doubling its price since its low point in June 2021, despite various adverse events such as the collapse of FTX, interest rate hikes, and stricter U.S. regulations.
ETH Market Price Analysis: Price History
At the time of writing, the price of Ethereum (ETH) is trading at $1,781.15, with a trading volume of $7,170,575,237 in the last 24 hours. Over the past 7 days, ETH has experienced a minor price increase of 0.30%, while its 24-hour performance shows a decline of 2.18%. With 120 million ETH tokens in circulation, Ethereum’s market capitalization is estimated at $214,470,877,141, making it the second-ranked cryptocurrency on CoinGecko.
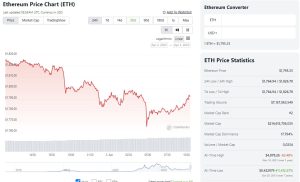
ETH price chart. Source: CoinGecko.com
Ethereum’s highest recorded price is $4,878.26, which occurred over a year ago on November 10, 2021. The current price represents a decrease of 63.51% from its all-time high. Conversely, the lowest recorded price for ETH was $0.432979 on October 20, 2015, over seven years ago. The current price is 411,010.94% higher than the all-time low price. Over the past 7 days, Ethereum’s price increase of 0.30% has underperformed the global cryptocurrency market, which has risen by 2.80%.
Previous ETH Price Analysis
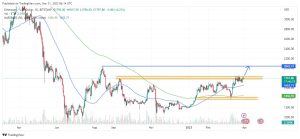
In the previous analysis, the price of ETH oscillated around $1800, but it had broken above the $1800 resistance low and was still in the resistance zone. At that time, the odds favored investors as the price could break above the resistance zone and reach the $2000 target.
During that time, a psychological support level had formed, preventing a further price fall. The price also traded above the 50-day and 200-day moving averages, indicating that the bulls were entirely under control. Furthermore, the relative strength index was bullishly strong and was trading above 50.
Based on the analysis back then, if the price had broken above the resistance zone, the $2000 target would have been inevitable. However, since the study is based on the past tense, it is unclear whether the price has broken above the resistance zone and reached the $2000 target.
ETH Price Prediction: ETH/USD Technical Price Analysis
As of April 3, Ether is currently testing its horizontal level resistance range, which could result in a potential breakout. The price of ETH is still oscillating along the resistance level at $1850 since the price has been in a 3-week consolidation phase that has maintained a strong resistance zone. Since the beginning of 2023, there has been an upward trend.
This surge in value has formed an ascending triangle pattern with rising trendlines as support and a horizontal level of resistance, indicating a definite buying trend. However, the consistently high resistance levels imply higher selling pressure, making a potential breakout move challenging.
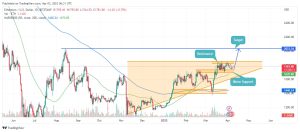
ETH/USD Chart Analysis. Source: Tradingview.com
Meanwhile, the 50-day and 200-day moving averages are still trading well below the market price, with the 50-day moving average trading below the psychological support at $1700. ETH is currently on a retracement. However, the support level at $1700 might cause the price of ETH to rebound and surpass the resistance level.
If this occurs, the bullish pattern of the ascending triangle will suggest a price target of between $3,350 and $3,900, based on where traders observe the triangle’s rising trendline support. The ascending triangle pattern suggests a positive trend for Ether, with the potential for significant gains if the breakout occurs.
Related
- Bitcoin Price Prediction for Today, April 2: BTC/USD Stays Around $28,300 Level
- Square Enix Drops New NFTs To Celebrate Final Fantasy VII’s 25th Anniversary
- US Government Sells 9,800 BTC, But Still Holds More Bitcoin In Wallets Than MicroStrategy!
Join Our Telegram channel to stay up to date on breaking news coverage