
Join Our Telegram channel to stay up to date on breaking news coverage
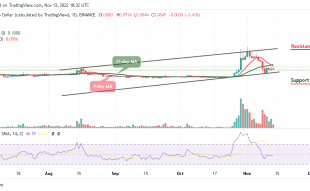
As the coin grows to the upside, the dYdX price prediction is likely to move consistently within the channel as the coin heads to the upside.
DYdX Prediction Statistics Data:
- DYDX price now – $2.364
- DYDX market cap – $155.4 million
- DYDX circulating supply – 65.5 million
- DYDX total supply – 1 billion
- DYDX Coinmarketcap ranking – #139
DYDX/USD Market
Key Levels:
Resistance levels: $3.0, $3.2, $3.4
Support levels: $1.5, $1.3, $1.1
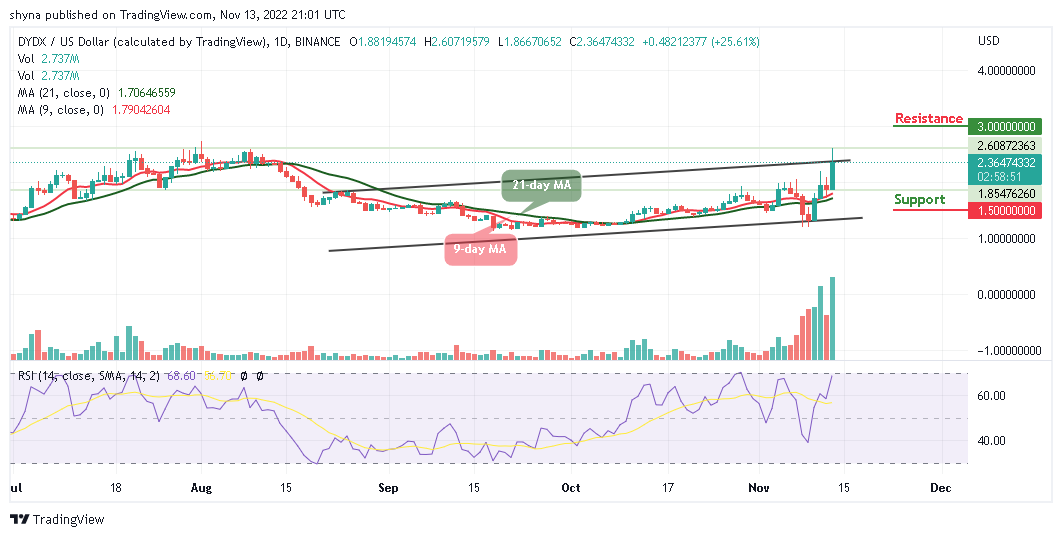
According to the daily chart, DYDX/USD is likely to stay above the 9-day and 21-day moving averages. In the last few days, the DYdX price has been struggling to cross into the positive side. As revealed by the daily chart, the technical indicator Relative Strength Index (14) is moving to cross into the overbought region, confirming the bullish movement for the coin.
DYDX Price Prediction: DYDX Price Ready for the Upside
As the daily chart reveals, the dYdX price is currently moving to the north. If the coin continues with the bullish movement, the bulls may cross above the upper boundary of the channel to hit the resistance levels of $3.0, $3.2, and $3.4. At the time of writing, DYDX/USD shows a slight bullish movement within the daily chart.
On the contrary, if the coin slide below the 9-day and 21-day moving averages, it could return the coin to the support levels of $1.50, $1.3, and $1.1 respectively. Meanwhile, the long-term buyers should not be bothered by the small impact on the road, as the future of DYDX is assured as revealed by the technical indicator Relative Strength Index (14).
Against Bitcoin, the DYdX price is hovering above the 9-day and 21-day moving averages as the coin moves to cross into the positive side. The technical indicator Relative Strength index (14) is also confirming the bullish movement as the signal line moves into the overbought region. On the contrary, a possible fall may surface if the technical indicator turns and faces downward, and it may likely cross below the lower boundary of the channel to hit the support level of 8500 SAT and below.
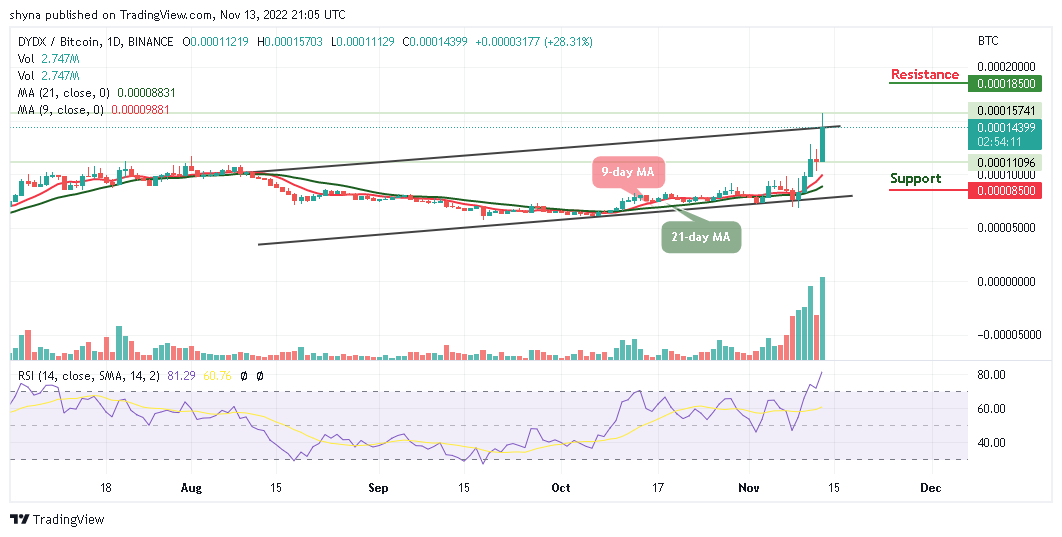
Meanwhile, any further bullish movement above the channel could push the coin to the resistance level of 1850 SAT and above, this could take the coin to a new high, and the market may remain in the bullish zone for a while.
The IMPT Token Presale Offers a Rare Investment Opportunity
The Impact Token is currently in the pre-sale phase. So far, the digital asset raises nearly $13 million in just one month.
D2T Token Price Is a Good Bargain
BitMart now has Dash 2 Trade listed after the pre-sale, along with LBank to get the token listed too. The D2T pre-sale is selling out fast and has already raised about $6 million for the future development of the platform.
Related:
Join Our Telegram channel to stay up to date on breaking news coverage