Join Our Telegram channel to stay up to date on breaking news coverage
DOGE Price Analysis – July 20
Dogecoin (DOGE) opened with a fall today. The coin is currently walking up at a steady pace. The indications are well off. The traders can benefit from the coin with the intraday trading.
DOGE/USD Market
Key Levels:
Resistance levels: $0.0038, $0.0040, $0.0042
Support levels: $0.0022, $0.0020, $0.0018

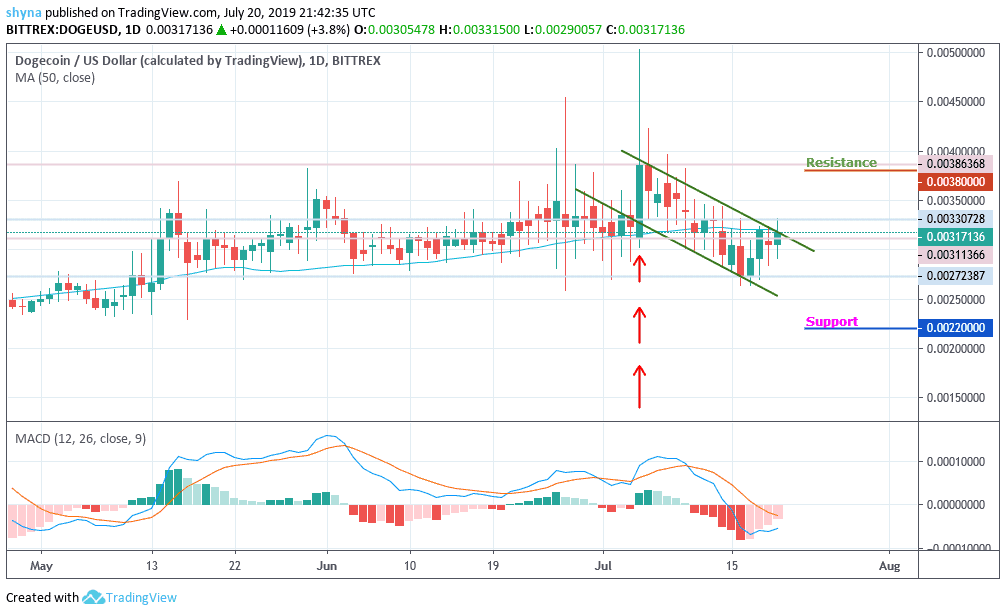
Dogecoin (DOGE) price is presently suffering in the market. The coin is believed to be crashed by selling pressure. In the last two days, the coin was seen surging up. Though the upsurge was not huge but gave the traders a sigh of relief. It appears that the coin will soon bounce back and regain its momentum.
As we can see from the chart, the month opened on a dull note. From 1st July to 4th July, the coin movement was the same. The coin started falling past the heavy leap. The price kept on slipping and touched a low at $0.0026. In the last few days, the coin escalated by 18.72% from $0.0026 to $0.0032. Currently, as reveals by the MACD indicator, the coin is again in the bearish zone with the support level of $0.0022, $0.0020 and $0.0018. The resistance levels to watch include $0.0038, $0.0040 and $0.0042 respectively
DOGE/BTC Market
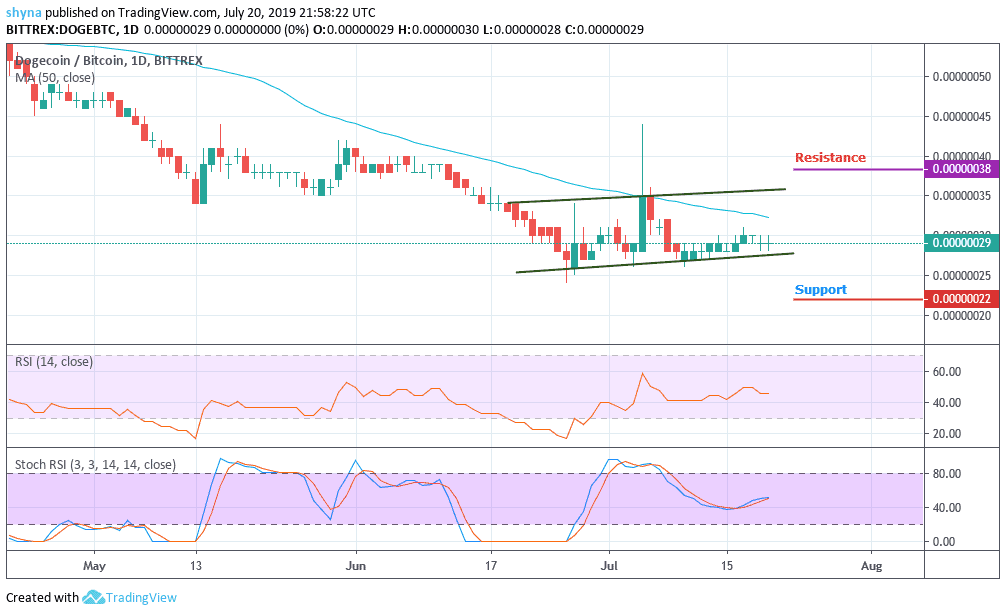
Against BTC, since the month started, the price has been in sideways and its support level is built around 22SAT, 20SAT and 18SAT, while the resistance level is set at 38SAT because the market price keeps moving below the 50-day moving average. Looking at it critically, the price kept moving up slowly within the channel.

Meanwhile, for the past few days, the market always closed the day with more green raising the hope of the buyers that in the near term, the market may likely cross the upper side of the channel to reach the resistance levels at 38SAT, 40SAT and 42SAT. The RSI and stochastic RSI signal lines neither move up or down but keeps moving sideways.
Please note: insidebitcoins.com is not a financial advisor. Do your own research before investing your funds in any financial asset or presented product or event. We are not responsible for your investing results.
Join Our Telegram channel to stay up to date on breaking news coverage


