
Join Our Telegram channel to stay up to date on breaking news coverage
The Dash price prediction shows that DASH could be ready for the uptrend, and it may fundamentally break above $35 respectively.
Dash Prediction Statistics Data:
- Dash price now – $32.75
- Dash market cap – $373 million
- Dash circulating supply – 11.3 million
- Dash total supply – 11.3 million
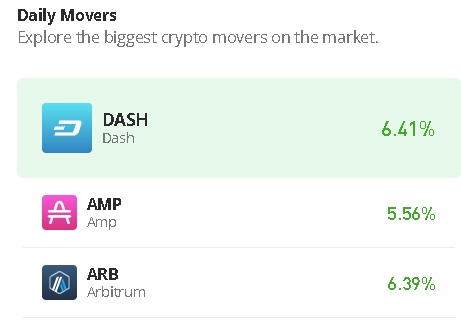
- Dash Coinmarketcap ranking – #91
DASH/USD Market
Key Levels:
Resistance levels: $43, $45, $47
Support levels: $22, $20, $18
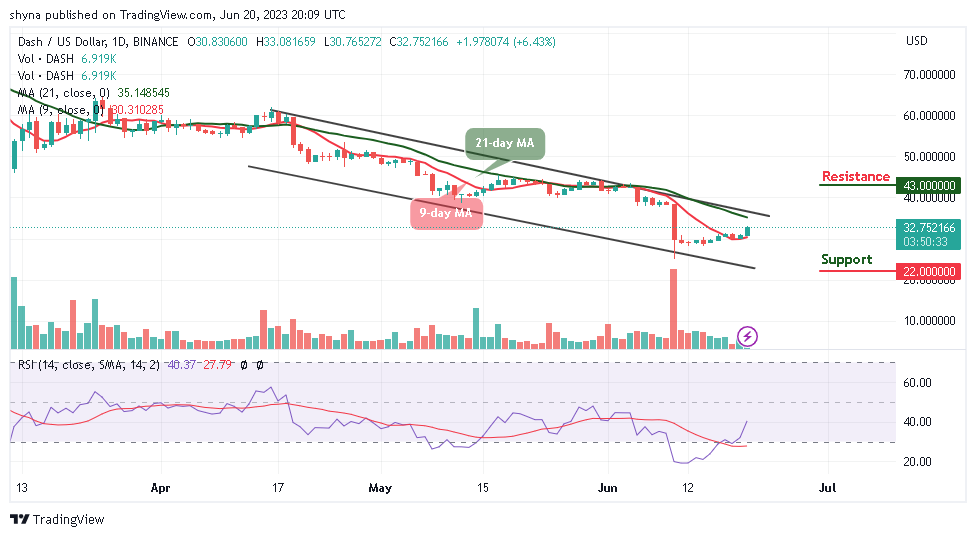
DASH/USD is likely to cross above the upper boundary of the channel to increase the bullish movement. Meanwhile, the cryptocurrency might kick-start another bullish run back above $60 if the buyers increase the pressure. Nevertheless, the Dash price has to keep the uptrend before hitting the $35 resistance level.
Dash Price Prediction: Dash (DASH) Trades Positively
The Dash price is currently hovering above the 9-day moving average. If the buyers begin to grind higher, the first resistance level may come at $35 as this could also be followed by $37. However, additional resistance levels can then be found at $43, $45, and $47. On the other side, if the Dash price slides and heads toward the lower boundary of the channel, it could hit the first support level at $25.
However, crossing below the lower boundary of the channel may lead to the critical support levels at $22, $20, and $18 respectively. The technical indicator Relative Strength Index (14) is moving to cross above the 40-level, which indicates that buyers may begin to gain control of the market, and this could also mean that another signal of DASH could be pushing towards the upside.
Against Bitcoin, the daily chart shows that the Dash price is attempting to cross above the 9-day moving average. As soon as the price stables above this barrier, there is a possibility that additional gains could be obtained. Therefore, the next resistance level is close to the 1250 SAT level. If the price keeps rising, it could even break the 1450 SAT and above.
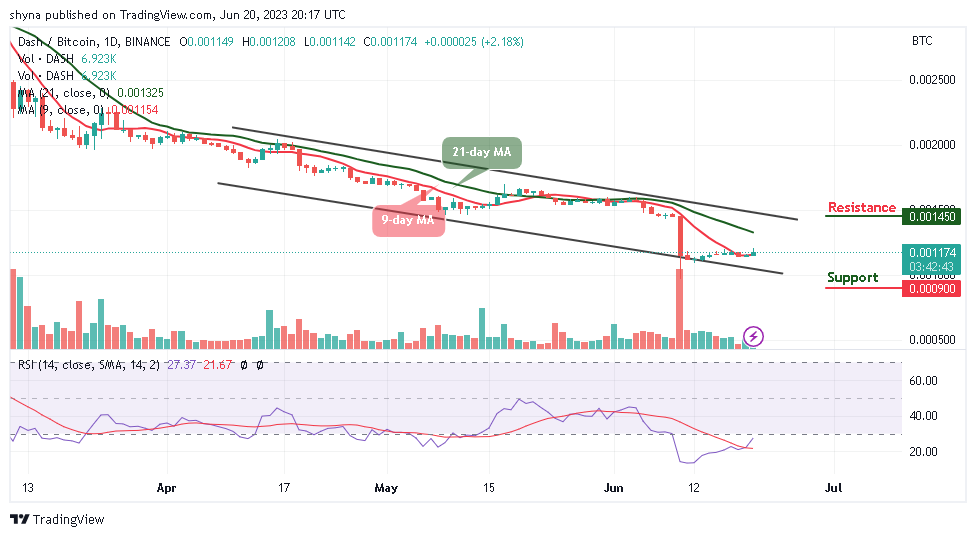
However, if the bears regroup and slide below the lower boundary of the channel, 1000 SAT support may play out before rolling to the critical support at 900 SAT and below. Meanwhile, the Relative Strength Index (14) is moving to cross above the 30-level, suggesting bullish movement.
Alternatives to Dash
The daily chart shows that the Dash price is attempting to create a new positive trend, and traders may expect a bullish continuation toward the upside, which could test the resistance level of $35. Similarly, the technical indicator Relative Strength Index (14) moves to cross above the 40-level, suggesting additional bullish signals.
According to its website, the Wall Street Memes crypto aims to “tokenize the movement”, referring to helping average everyday investors get rich off useless meme coins in the face of traditional finance. Therefore, the token has raised almost $9m in the ongoing presale.
Read more:
- Litecoin Price Prediction: LTC/USD Faces Rejection at $76 as Bulls and Bears Contemplate the Next Move
- Bitcoin Price Prediction: Bitcoin (BTC) Breakout Looms as Price Consolidates in the $9,800 Region
- Ripple Price Prediction: XRP/USD Tested Support Level near $0.26 but Regains Stability Above $0.27
CoinCodex - Our Recommended Crypto Research Platform

- Live Cryptocurrency Prices for Over 20,000 Coins
- Crypto Price Analysis with Popular Technical Indicators
- Crypto Price Predictions with Short and Long-Term Charts
- Historical Crypto Market Data Dating to 2010
- Crypto Portfolio, Profit Calculator, and Other Investment Tools
Join Our Telegram channel to stay up to date on breaking news coverage