Join Our Telegram channel to stay up to date on breaking news coverage
Litecoin (LTC) Price Prediction – November 18, 2020
LTC/USD breaks $68 overhead resistance as price reaches the previous high at $76. The upward move has been impeded as the price reaches a high of $76. Presently, LTC is fluctuating between $70 and $76 as bulls and bears wait for the next move. The LTC/BTC has resumed downward move after rejection at Ƀ0.004500.
LTC/USD Market
Key Levels:
Resistance Levels: $80, $100, $120
Support Levels: $50, $40, $20
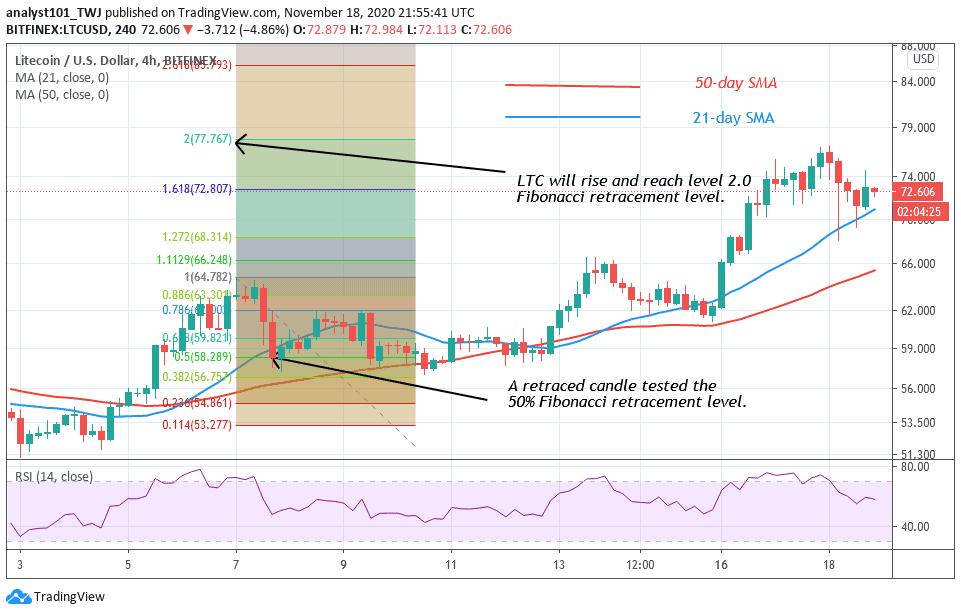
Litecoin is trading at $73 after retesting the previous high at $76. LTC is consolidating above $70 as they fail to break above the $76 resistance. Presently, BTC is fluctuating between $70 and $76. On the upside, if the price breaks the $76 resistance, the upward move will resume. LTC will rise and possibly reach the February price level of $80. The bears take advantage to break the support at $70 if the bulls fail to break into previous highs. Conversely, the bears will attempt to push LTC below the $68 support by breaking the $70 support. Subsequently, the price will fall to a low at $64. Meanwhile, LTC is trading at $73 at the time of writing.
Litecoin Indicator Analysis
The crypto price is at level 69 of the Relative Strength Index period 14. The coin was earlier in the overbought region but has fallen to the uptrend zone. It indicates it is capable of rising. The price bars are well above the SMAs which indicates a possible rise of the coin.
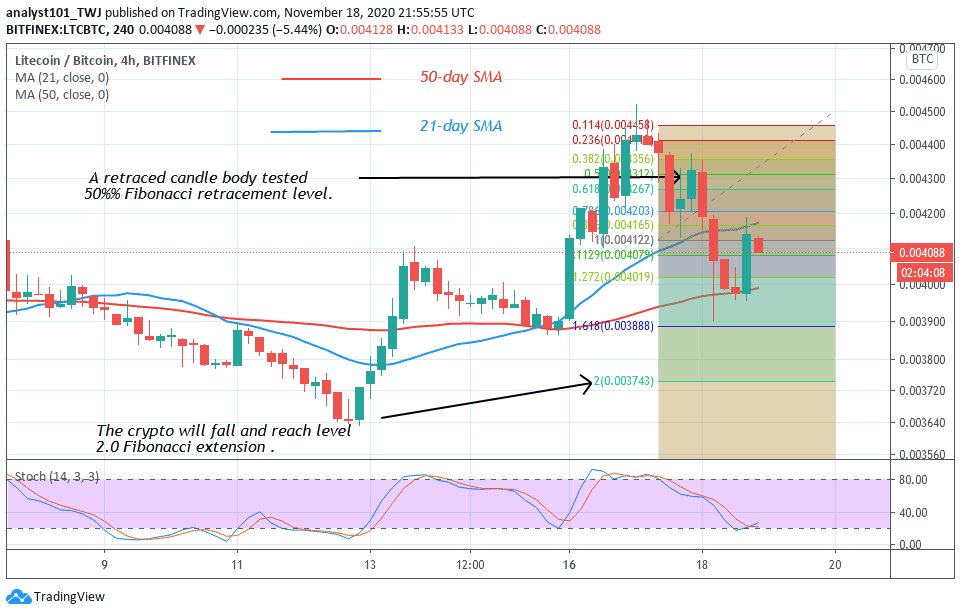
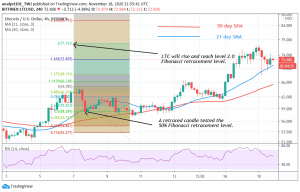
On the LTC/BTC chart, November 16 uptrend was terminated at level Ƀ0.004500. The retraced green candle tested the 50% Fibonacci retracement level. It indicates that the market will fall to level 2.0 Fibonacci extension or Ƀ0.003743. The coin is below the 25% range of the daily stochastic which indicates that it is in a bearish momentum.
Join Our Telegram channel to stay up to date on breaking news coverage