Join Our Telegram channel to stay up to date on breaking news coverage
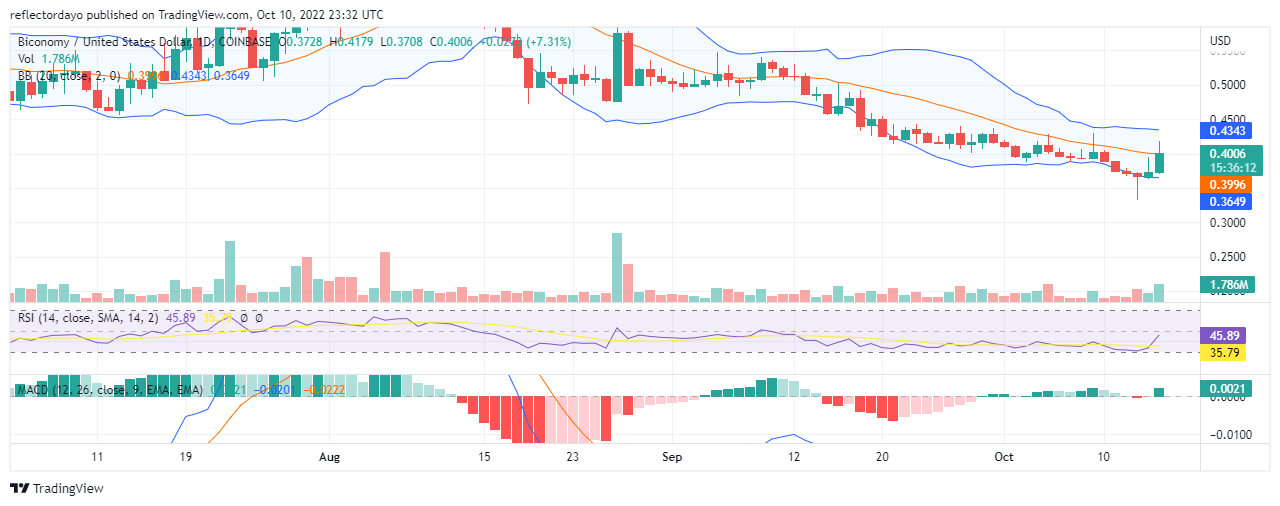
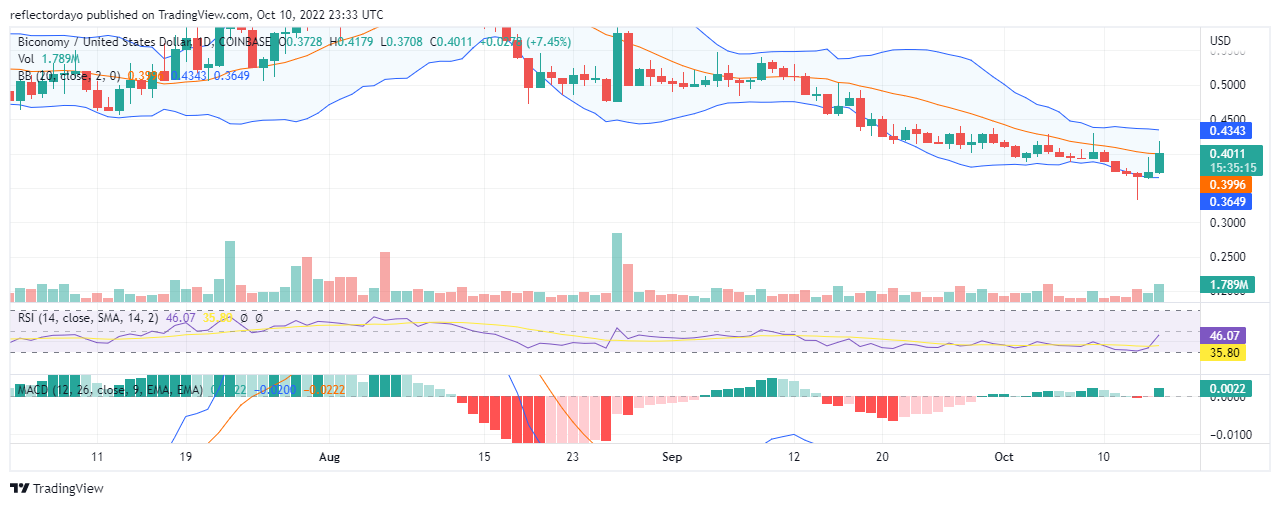
The $0.5318 Price level forms the resistance level which also becomes the pivot point for the direction of the Biconomy market that went in favour of the sellers. From the 10th of September to the 13th of September, the market was in a long-term downtrend. Along the line, buying pressure slows down the downward trend. Then Bulls began to take the market in yesterday’s market, but they almost lost all the ground they have taken.
Biconomy Market Price Statistic:
- BICO/USD price now: $0.4004
- BICO/USD market cap: $
- BICO/USD circulating supply:
- BICO/USD total supply: 1,000,000,000
- BICO/USD coin market ranking: #
Key Levels
- Resistance: $ 0.4344, $0.4500, $0.5000
- Support: $0.4000, $0.3500, $0.30000
Your capital is at risk
Biconomy Market Price Analysis: The Indicators’ Point of View
The market indicators of the Relative Strength Index have been moving in a side-way ranging fashion since the 13th of September. The RSI line could not fall below the level due to bullish resistance. Although from this indicator, the price appears to be ranging, from the main chart, the price was slightly going in favour of the bears. The strong and sharp spike in the market price has raised the RSI line to 45.7%. And it is now almost crossing into the overbought zone.
BICO/USD 4-Hour Chart Outlook
In the Second hour of today’s session, the buyers increased their momentum. And the price reached the $0.4211 price level from $0.3713. At that height, traders begin to sell as they take profits. This made the price fall back to the current price. Looking at the momentum of this market, the bullish trend may continue. The bulls have been active in the market all along in the bearish market, it was just that they don’t have enough strength to take the market. But now the bulls are gaining the upper hand in the market.
Join Our Telegram channel to stay up to date on breaking news coverage
