
Join Our Telegram channel to stay up to date on breaking news coverage
From the 23rd of September to the 3rd of October, the Orchid market went into a consolidation period. The consolidation period was characterized by some consecutive spinning top candlestick patterns that appear between the 26th of September and to 1 of October. But from the 6th of October to the 12th of October, the market began to slightly move in favour of sellers as they began to have the upper hand.
Orchid Market Price Statistic:
- OXT/USD price now: $0.1084
- OXT/USD market cap: $75,194,219
- OXT/USD circulating supply: 690,690,083.77
- OXT/USD total supply: 1,000,000,000
- OXT/USD coin market ranking: #274
Key Levels
- Resistance: $ 0.1150, $0.1200, $0.1250
- Support: $0.9500, $0.9000, $0.8500
Your capital is at risk
Orchid Market Price Analysis: The Indicators’ Point of View
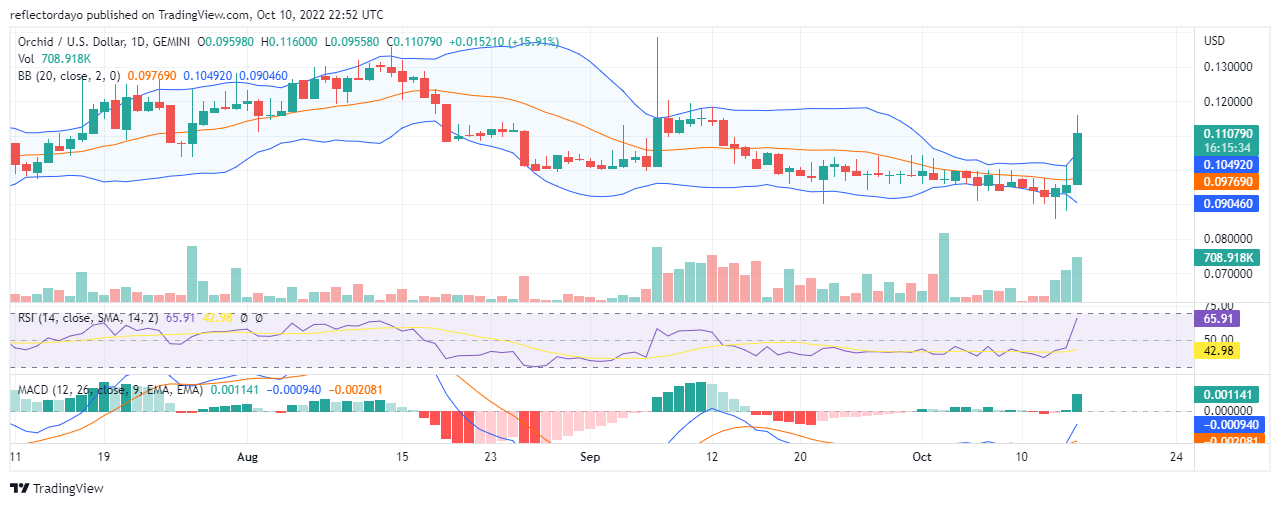
The market took a new turn when the price formed a support level at $0.0924 on the 13th of October. The general volume of trade began to increase daily. And more traders are willing to buy than to sell. The trading session for yesterday’s market was very volatile as the struggle between bulls and bears was very rough, however, the bulls won.
The wild pull and push in the market resulted in the widening of the Bollinger bands. Initially after the consolidation period, and at the time when the market went slightly in favour of the sellers, the two bands of the indicator compressed against the price action. But as the volume of trade increases on the 14th of October, the upper and lower bands begin to expand.
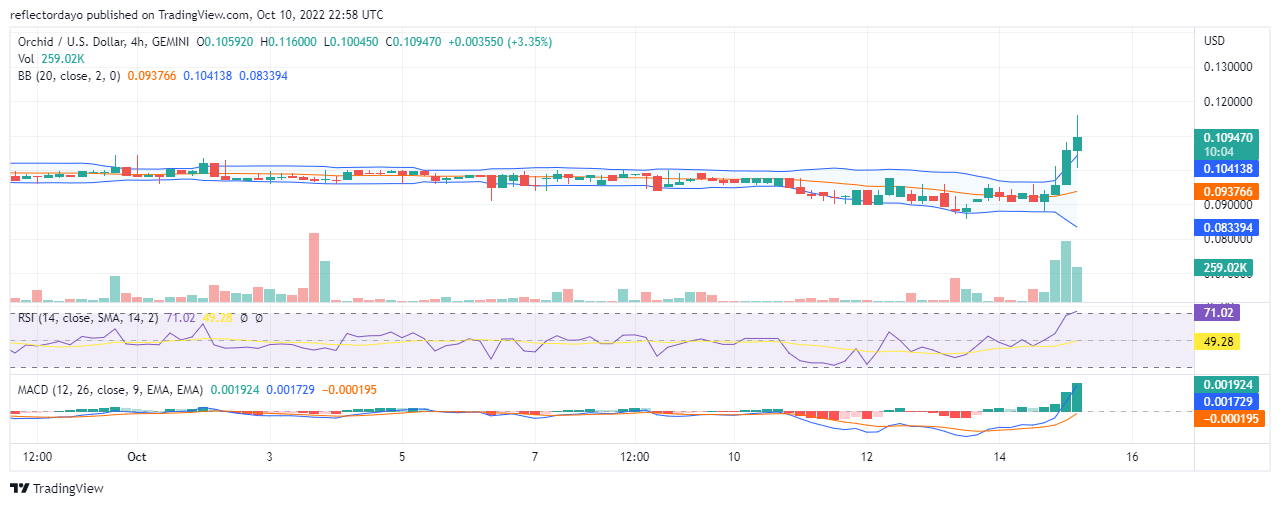
ORX/USD 4-Hour Chart Outlook
In this 4-hour chart, we see the RSI line slightly crossing the threshold of the overbought territory (measuring 70.97%). And the candle that represents the third session of today’s market shows high volatility. However, more traders are willing to buy than to sell. But with the price action reaching into the overbought and the market volatility increasing, the probability for a trend reversal is increasing.
Join Our Telegram channel to stay up to date on breaking news coverage