
Join Our Telegram channel to stay up to date on breaking news coverage
During the European session today, the Curve price prediction begins a progressive movement as the price increases slightly.
Curve Prediction Statistics Data:
- Curve price now – $0.96
- Curve market cap – $710.4 million
- Curve circulating supply – 733.8 million
- Curve total supply – 1.9 million
- Curve Coinmarketcap ranking – #66
CRV/USD Market
Key Levels:
Resistance levels: $1.40, $1.50, $1.60
Support levels: $0.65, $0.55, $0.45
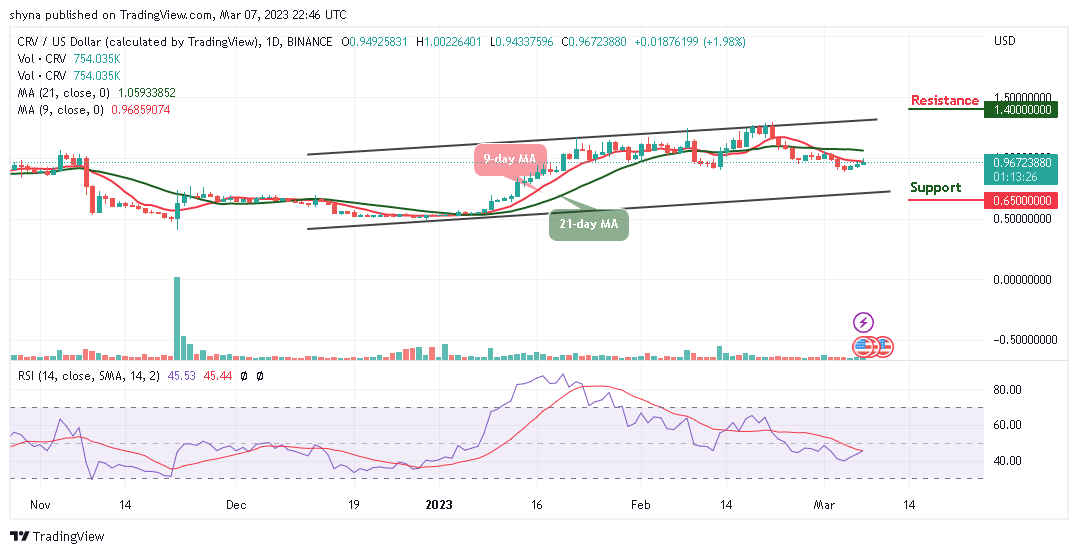
CRV/USD bulls have been attempting to move above the 9-day and 21-day moving averages. The $0.94 support level is the critical support where the price touched today. Meanwhile, the Curve price has earlier trades around this level before making an upward movement and this makes the support level a strong support zone.
Curve Price Prediction: Can Curve Move to the Upside?
The Curve price is likely to rise more if the bulls could defend the $0.95 level; the coin may continue its upward movement by breaking above the 21-day moving average after keeping the price above the 9-day moving average. Therefore, any further bullish movement may take the coin to the potential resistance levels of $1.40, $1.50, and $1.60.
However, as revealed by the daily chart, the current prediction may be invalidated should the bears break below the $0.90 level, and the Curve price may fall to the low of $0.65, $0.60, and $0.55 support levels. Moreover, the technical indicator Relative Strength Index (14) is crossing into the positive side; suggesting more bullish movements.
Against Bitcoin, the Curve price is currently trading above the 9-day moving average. However, the red line of the 9-day moving average may likely make a bullish cross above the green line of the 21-day moving average to touch the nearest resistance of 5000 SAT.
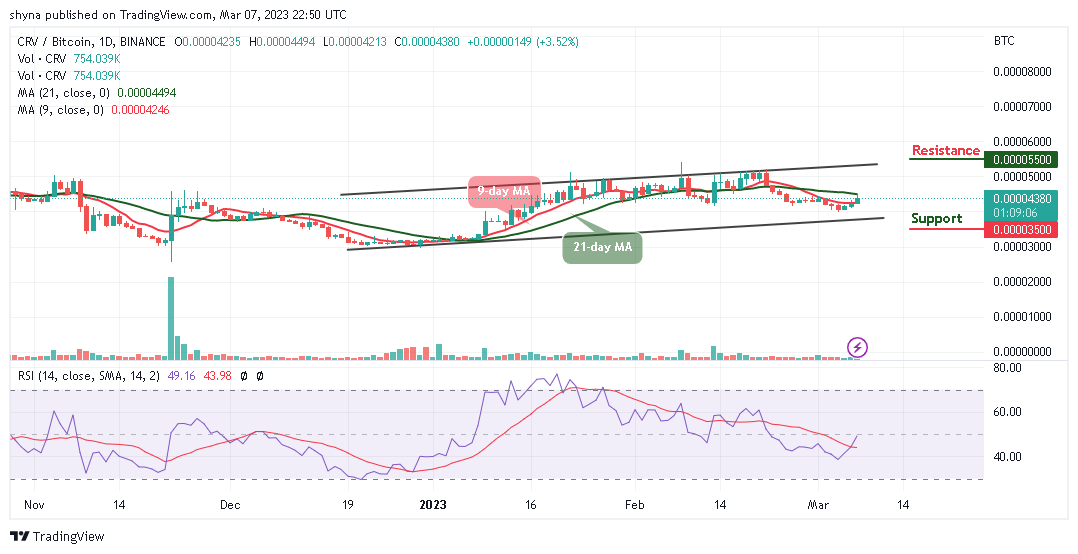
Therefore, if the buyers could push the price towards the upper boundary of the channel, higher resistance lies at 5500 and above. Moreover, should the bulls fail to move it upward, then, the nearest support level could be located at 3500 SAT and below. Moreover, the technical indicator Relative Strength Index (14) is moving to cross above the 50-level, which indicates that buyers may dominate the market.
Curve Alternatives
The Curve price may begin to follow the bullish movement if buyers push and keep the coin above the resistance at $1.00. Meanwhile, the bullish momentum is likely to play out as this could extend the price of the coin to the next resistance at $1.20. On that note, the FGHT token gives you the ability to optimize your trading and speculative profitability with effective crypto trading recommendations. The FightOut presale is ongoing as almost $5.5 million has been raised since the beginning of the presale.
Join Our Telegram channel to stay up to date on breaking news coverage