Join Our Telegram channel to stay up to date on breaking news coverage
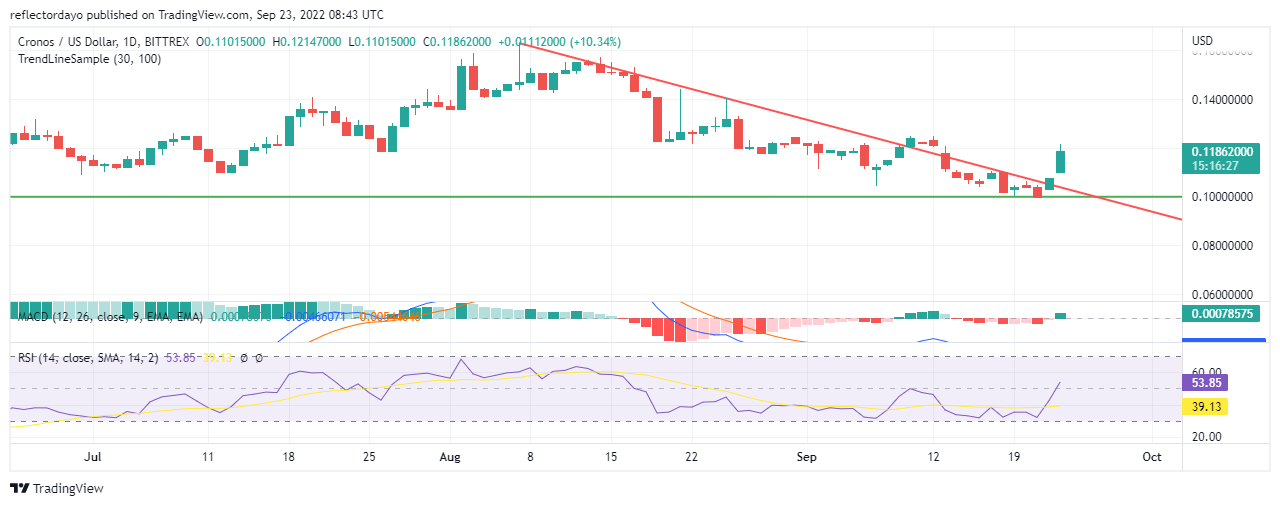
At the height of $0.15520894 and on the 13th of August, the uptrend switched to a downtrend. CRO/USD continued to go this way (with very strong bearish momentum) until the 21st of September when the market trend changed direction in favour of bulls. As the market trended downwards, at some points, bullish resistance tried to forestall bearish advancement, but they were unable to do so.
Cronos Market Price Statistic:
- CRO/USD price now: $0.11862000
- CRO/USD market cap: $2,919,886,528
- CRO /USD circulating supply: 25,263,013,692
- CRO /USD total supply: 30,263,013,692
- CRO /USD coin market ranking: #27
Key Levels
- Resistance: $0.121475, $0.125000, $0.129825
- Support: $0.101575, $0.097075, $0.93750
Your capital is at risk
Cronos Market Price Analysis: The Indicators’ Point of View
As demand and supply struggle along the bearish slopes, the trendlines of the resistance and support levels form a significant candlesticks pattern. The formation is known as a falling wedge triangle pattern. The candlesticks triangle pattern signals (beforehand) the change of the trend to a bullish one. After forming the support level of $0.101975 between yesterday and the 20th of September, the bullish trend begins with very strong momentum. The candle for yesterday shows very strong buying activities for the day’s session. Sellers were almost relegated in yesterday’s market.
The bullish trend also continued into this day’s trading session. However, sellers regain a bit of strength at the height of $0.122075 and they were able to balance the price with the buyers at the current price of $0.116800. The Relative Strength Index shows a market trying to recover from the down zone to the up zone. And it has already entered the upper zone as the RSI line now measures 51%. The market was able to recover from the down zone to the up zone within the space of 2 days. With this type of momentum, we can confirm that the trend has changed to a bullish one.
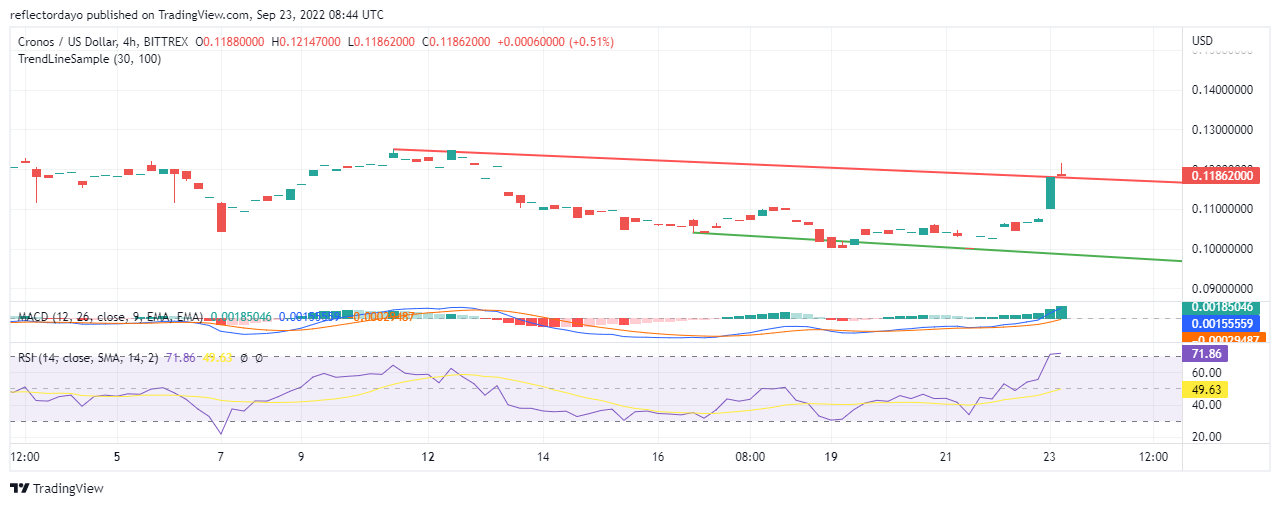
Cronos: CRO/USD 4-Hour Chart Outlook
Today opened with the first four hours being almost bullish. The type of candlestick pattern for this session is almost like a marubozu candle. It is a highly significant bullish trend candlestick. After this session sellers came on board and bring the price a bit low. In the RSI, it shows that the price was just recovering from the overbought. It is very likely that the bullish trend continue because a brief price rebound is expected when the market enters the overbought
Related
Join Our Telegram channel to stay up to date on breaking news coverage