
Join Our Telegram channel to stay up to date on breaking news coverage
The Cosmos price prediction shows that ATOM may begin to show a bullish movement if the market could rise above the moving averages.
Cosmos Prediction Statistics Data:
- Cosmos price now – $10.95
- Cosmos market cap – $3.1 billion
- Cosmos circulating supply – 286.3 million
- Cosmos Coinmarketcap ranking – #21
ATOM/USD Market
Key Levels:
Resistance levels: $13.0, $14.0, $15.0
Support levels: $9.0, $8.0, $7.0
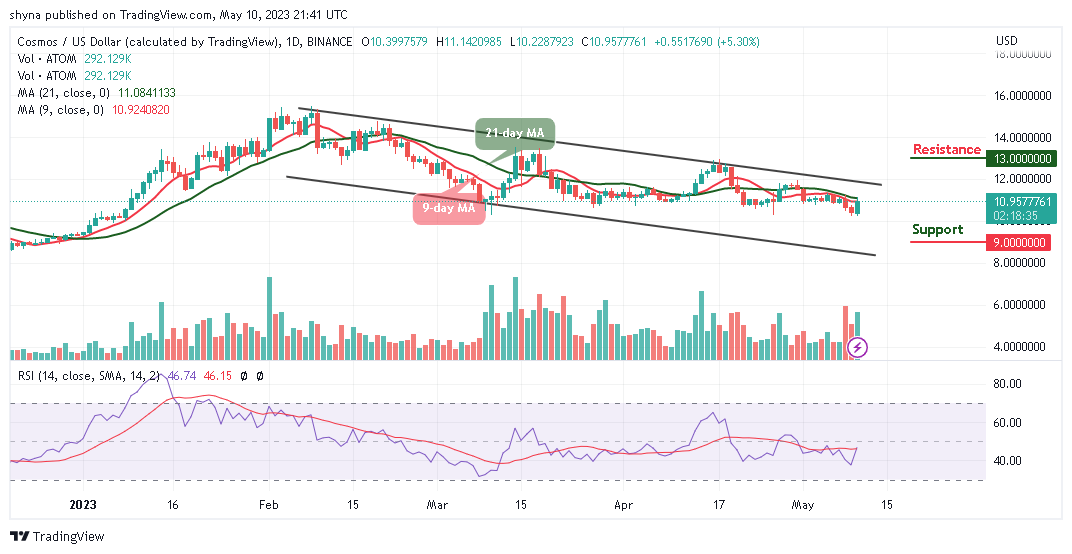
ATOM/USD is showing positive movement as the market moves to cross above the 9-day and 21-day moving averages. Apart from this, the price of Cosmos still has to conquer the resistance level of $12.0 within the channel and traders can expect the price to continue to rise as soon as this is done.
Cosmos Price Prediction: Cosmos Price Could Shoot to the North
The daily chart shows that the Cosmos price regains back above the 9-day moving average because any further bearish movement may bring the coin toward the lower boundary of the channel which could hit the support levels at $9.0, $8.0, and $7.0. On the upside, a sustained move above the upper boundary of the channel may create more strength for the bulls, focusing on moving the market to the next resistance levels of $13.0, $14.0, and $15.0 respectively.
At the moment, the technical indicator Relative Strength Index (14) is likely to cross above the 50-level, which indicates that the market may move to the upside. Looking at the daily chart, there may be a need for support to be formed around $10.0 and $9.5 to provide tight protection which could allow the buyers to concentrate on stirring action to the north.
Against Bitcoin, the Cosmos price crosses above the 9-day and 21-day moving averages as the buyers push the price to the upside. Crossing above the upper boundary of the channel may hit the nearest resistance level of 4500 SAT while the technical indicator Relative Strength Index (14) crosses above the 50-level.
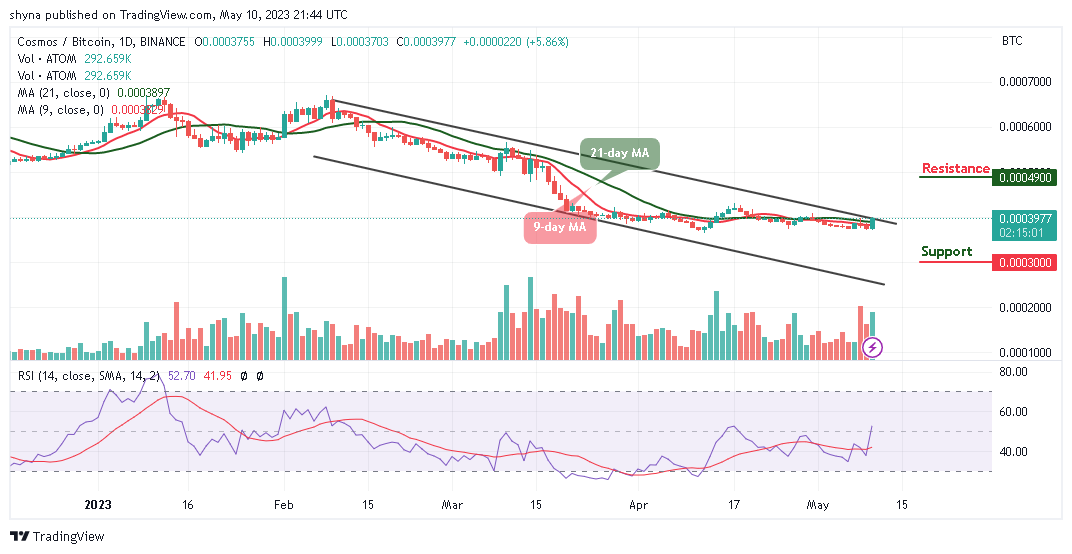
However, if the bulls succeeded in breaking above the channel, the ATOM price could touch the potential resistance level at 4900 SAT and above. On the contrary, any bearish movement toward the lower boundary of the channel may bring the price to the support level of 3000 SAT and below.
Cosmos Alternatives
As the daily chart reveals, the Cosmos price is likely to trade above the 9-day and 21-day moving averages. On the upside, if the price breaks above the upper boundary of the channel and closes above it, ATOM/USD may likely create additional gains. Nonetheless, AiDoge (Ai) represents a meme coin that can pump just like one of the above coins but it has properties that mean it won’t be just another rug pull and instead will be around for the long run. Moreover, the token has already raised up to $6 million in the ongoing presale.
Join Our Telegram channel to stay up to date on breaking news coverage