Join Our Telegram channel to stay up to date on breaking news coverage
The Cosmos price prediction may lack short-term, but if the price rises, the coin is likely to create more gains above the channel.
Cosmos Prediction Statistics Data:
- Cosmos price now – $9.49
- Cosmos market cap – $3.2 billion
- Cosmos circulating supply – 346.6 million
- Cosmos Coinmarketcap ranking – #23
ATOM/USD Market
Key Levels:
Resistance levels: $11.50, $12.00, $12.50
Support levels: $7.50, $7.00, $6.50
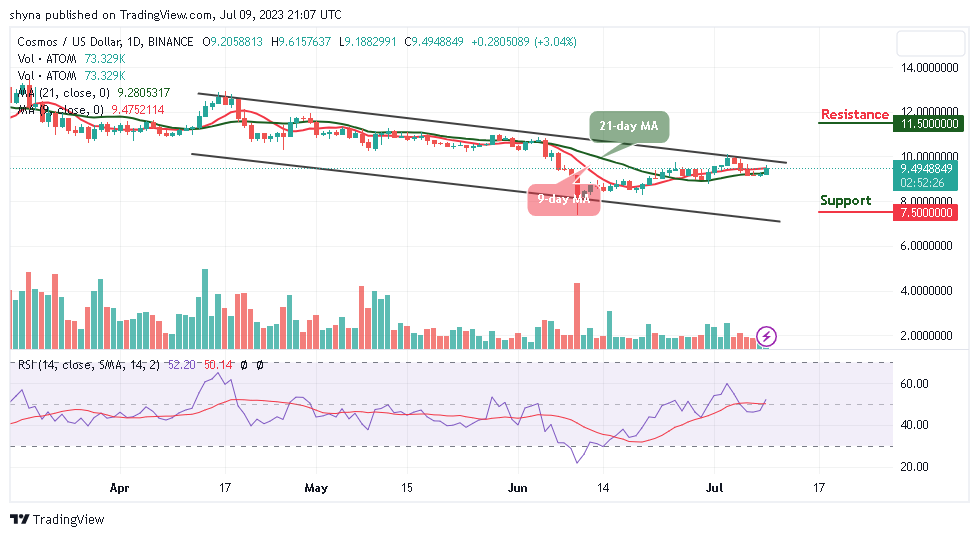
ATOM/USD is currently trading around the $9.49 level, aiming to cross above the 9-day moving average. In the range of the descending channel, the closest support could be located at $9.00 while a close resistance could be found at $9.70. Meanwhile, if the market increases, additional resistance can be found above the upper boundary of the channel.
Cosmos Price Prediction: Cosmos Ready to Push the Upside
According to the daily chart, the Cosmos price may create more bullish trends once the coin crosses above the 9-day and 21-day moving averages, and this is noticeable for the technical indicator Relative Strength Index (14) as the signal line crosses above the 50-level.
At the moment, the market is trading at $9.49 within the moving averages, but any bearish movement below the daily low of $9.18 could lead the coin to a serious downtrend. However, the support levels could be located at $7.50, $7.00, and $6.50, while the resistance levels lie at $11.50, $12.00, and $12.50 respectively.
Against Bitcoin, the ATOM price may continue to move above the 9-day and 21-day moving averages as the nearest support level is located around 3034 SAT. However, if the coin spikes to the upside, the nearest resistance is set at 3500 SAT. Technically, the price may follow the bullish movement as the technical indicator Relative Strength Index (14) moves to cross above the 50-level.
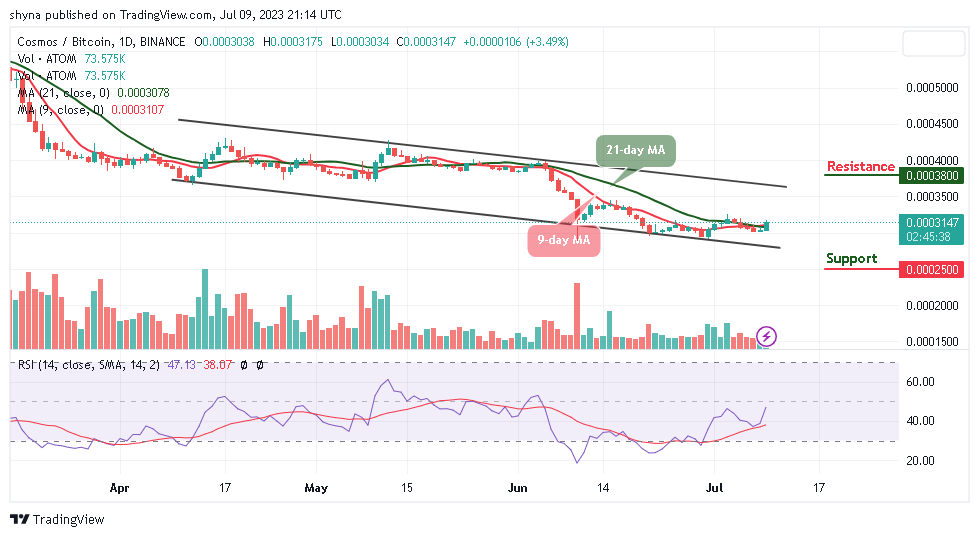
However, if the Cosmos price slides below the lower boundary of the channel, it could hit the support level of 2500 SAT and below. Nevertheless, any further bullish movement toward the upper boundary of the channel may allow the market to form a new upward trend, and this could reach the potential resistance at 3800 SAT and above.
Cosmos Alternatives
The Cosmos price can only maintain the uptrend if the newly touched $9.61 resistance level is maintained at all costs. At the time of writing, the technical indicator Relative Strength index (14) is crossing above the 50-level to create more bullish signals in the market, and this could encourage more buyers to enter the market.
Aside from that, Wall Street Memes also harnesses the potential of a community that extends beyond 1 million followers across several social media platforms, including Instagram. Its internet community is celebrated for engaging and hilarious content surrounding financial markets, including stocks and cryptocurrencies. Meanwhile, there has already been close to $13 million raised during the presale.
New OKX Listing - Wall Street Memes

- Established Community of Stocks & Crypto Traders
- Featured on Cointelegraph, CoinMarketCap, Yahoo Finance
- Rated Best Crypto to Buy Now In Meme Coin Sector
- Team Behind OpenSea NFT Collection - Wall St Bulls
- Tweets Replied to by Elon Musk
Join Our Telegram channel to stay up to date on breaking news coverage