Join Our Telegram channel to stay up to date on breaking news coverage
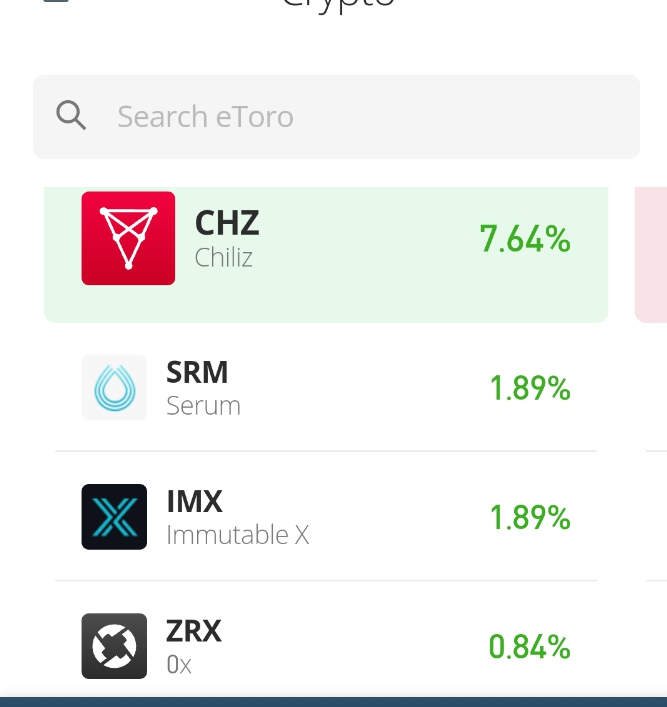
CHZ/USD displaces LUNC/USD to get to the top position on today’s crypto daily mover list. Chillz move just 7.46% today, but it was enough to earn it the number one spot on the list.
Chillz present price Price: $0.1177
Chillz Market Capitalization: 703 Million
Chillz Total Supply: 8.9 Billion
Chillz Rank: 63
Key Levels:
Resistance: $0.1177, $0.1200, $0.1300
Support: $0.1125, $0.1100, $0.1075
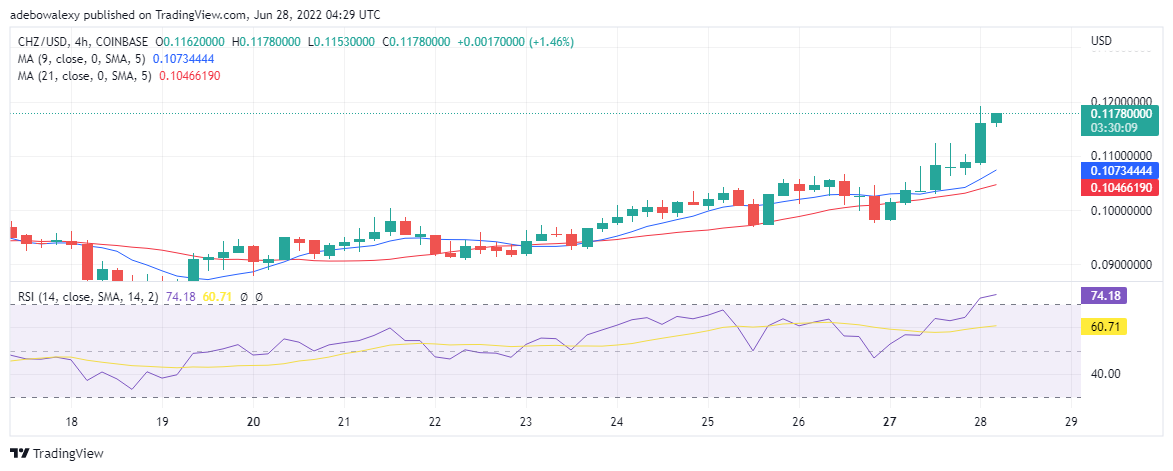
CHZ/USD Price Prediction: Chillz Attracts Relatively Large Gains
Studying Chillz four-hour chart, we will observe that this crypto is experiencing a relatively massive uptrend. Furthermore, we can see that the market is bullish, as the last few candlesticks were all bullish. Also, we can see that 9 and 21-day moving averages are both below the value activity, which affirms the market bullishness. As a result of these, the crypto has gained about $0.00780 in value which is significant, given the value of the crypto.
Moving on, the Relative Strength Indicator shows that the value of CHZ/USD may increase further. This is because there is still room for upside movement.
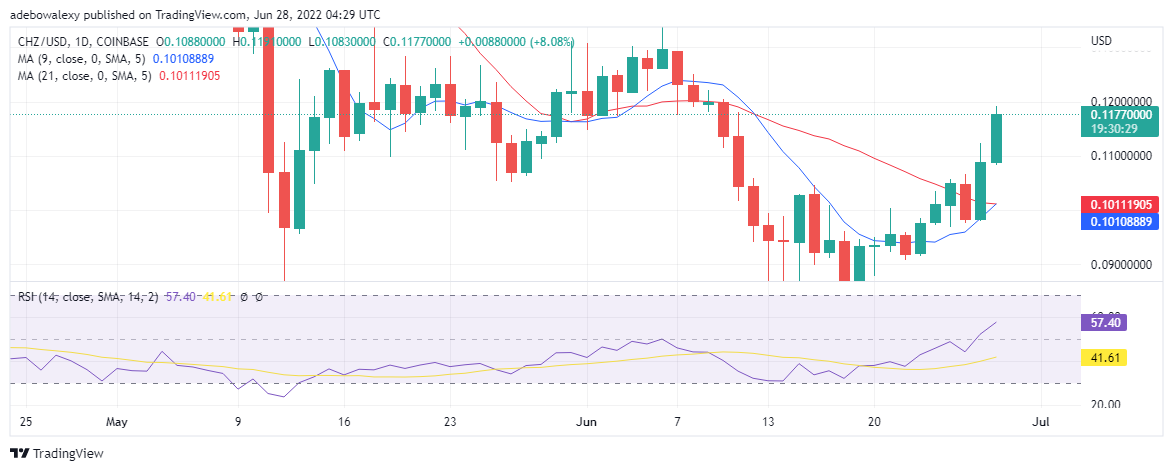
CHZ/USD Price Prediction: Chillz May Witness More Upward Thrust
CHZ/USD daily chart foretells this crypto may see more increase in value within the next 24 hours. The moving averages have touched their tips, which indicates more up thrust in value. I’m addition, the large bullish candlesticks reveal that the volatility in this market is high. If the volatility is maintained a bit long the crypto may value at $0.1200 and $0.1400 very soon.
Furthermore, the Relative strength indicator is revealing that the value gain may rain for some time. The above inference is drawn from the activity of the RSI indicator, as the faster curve bounced away from the slower one and towards the highly bought area of this indicator.
Join Our Telegram channel to stay up to date on breaking news coverage