Join Our Telegram channel to stay up to date on breaking news coverage
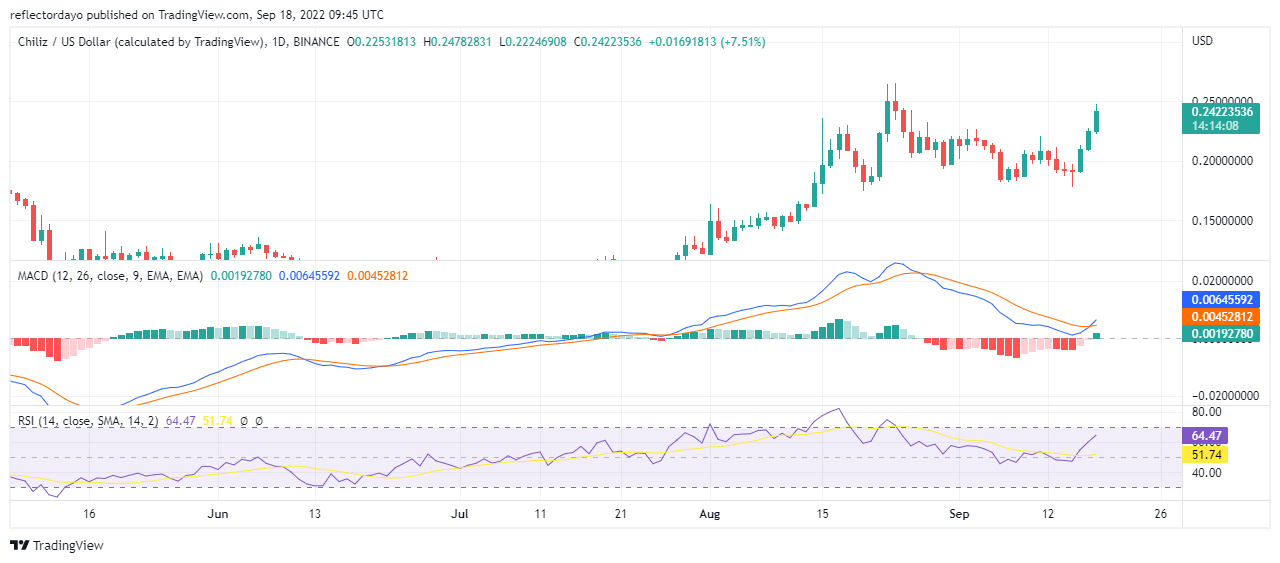
After the Standoff between CHZ/USD bears and bulls on the 13th and 14th of September, the market begins to skyrocket. The buying pressure had started to increase from the 13th up till this moment. And the price of the market is about to retrace the $0.2500000 resistance level. Judging by this bullish market momentum, the price may break the $0.2500000 price level soon.
Chiliz Market Price Statistic:
- CHZ/USD price now: $0.24001330
- CHZ /USD market cap: $ 1,436,807,102
- CHZ /USD circulating supply: 6 billion
- CHZ /USD total supply: 8,888,888,888
- CHZ /USD coin market ranking: #37
Key Levels
- Resistance: $0.25000000, $0.26666514, $1.8187436
- Support: $0.20000000, $1.78688200, $0.15000000
Your capital is at risk
Chiliz Market Price Analysis: The Indicators’ Point of View
Even though we can see this very bullish momentum in the market since the 16th of September, the market is just transiting into a bullish trend. This is because, in the MACD, the fast line had just crossed the signal line. Also, the price needs to completely rally to break the $0.2500000 to fully establish the bullish market. Also, the three consecutive candlesticks which are also known as ‘three white soldiers’ are very significant to portray a very bullish momentum.
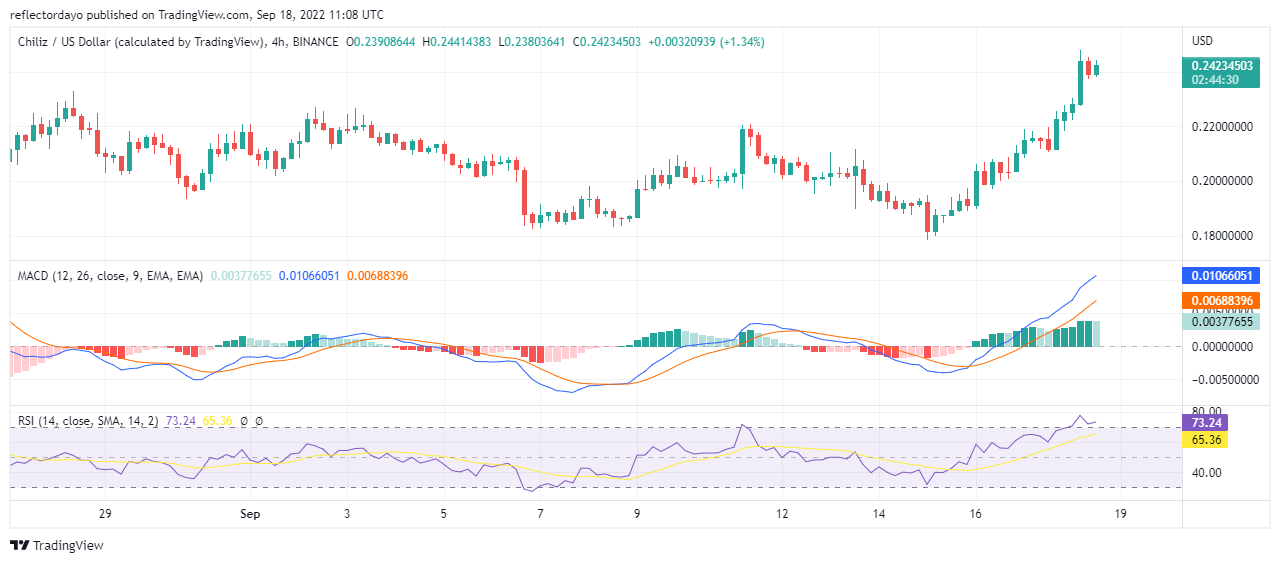
Chiliz: CHZ/USD 4-Hour Chart Outlook
In this timeframe, the MACD shows that the indicating lines crossed out of the weaker zone on the 15th of September. Also from this point of view, we can see that the price has been making some progressive advancements above point zero of the MACD. But the last bearish candlestick on the 4-hour chart is showing a weakening in the momentum. According to the RSI, it may be that the market had entered the overbought territory. And it is correcting the price to prepare for a bullish continuation
Related
Join Our Telegram channel to stay up to date on breaking news coverage