
Join Our Telegram channel to stay up to date on breaking news coverage
LINK Price Prediction – September 4
There has been the feeling that the Chainlink market is struggling to push northward against the purchasing power of the US Dollar. In the wake of keeping the trading signal positive, the price features around $7 at an average percentage rate of 4.44.
LINK Price Statistics:
LINK price now – $7.16
LINK market cap – $3.5 billion
LINK circulating supply – 491.6 million
LINK total supply – 1 billion
Coinmarketcap ranking – #23
LINK/USD Market
Key Levels:
Resistance levels: $8, $9, $10
Support levels: $6, $5, $4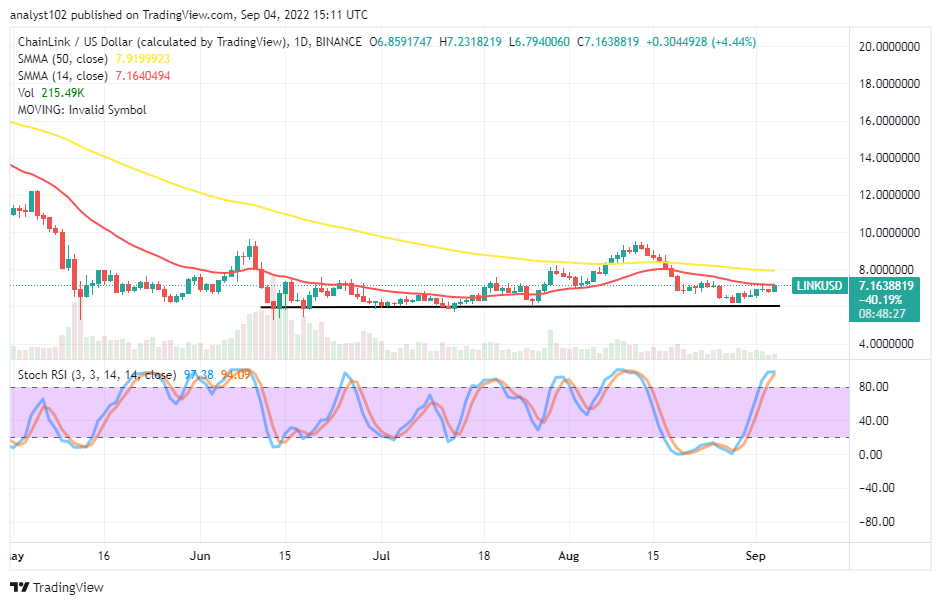 LINK/USD – Daily Chart
The daily chart showcases the Chainklink market is struggling to push northward against the US Dollar. The 14-day SMA indicator is at a $7.16 value line below the $7.92 point of the 50-day SMA indicator. The horizontal line drew at the $6 support level. The Stochastic Oscillators have penetrated the overbought region, keeping the range values of 94.09 and 97.38 to suggest the possibility of the crypto economy beefing further upside is dicey at this current trading pace.
Your capital is at risk.
Which direction the LINK/USD market tends to follow next?
As the LINK/USD market is struggling to push northward against the resistance of the 14-day SMA, the crypto trade tends to lose ideal momentum towards achieving stable ups in the near time. In light of that assumption, buying habits need to be on hold for a while. Even though the market may maintain moving thinly and systemically to test a higher resistance of the bigger SMA at $7.92, buyers may lose out on getting in lately.
On the downside of the technical analysis, bears are seemingly getting set to control the market between the value point of the 14-day SMA and the 50-day SMA in the nears session. It may take several days before that presumed analytics scenario will be. That calls for exercising patience before a set of trading patterns required takes a form to indicate full-fledged exhaustion of buying spree afterward.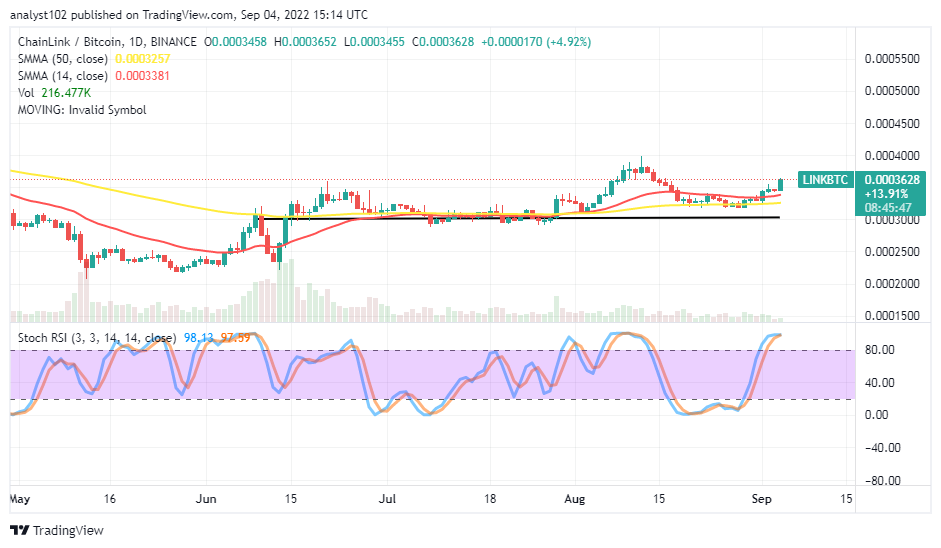
LINK/BTC Price Analysis
In comparison, Chainklink has continued to put up with a bullish-moving mode against Bitcoin. The cryptocurrency pair price has been on the buying signal sides of the SMA trend lines to push northward further. The 14-day SMA indicator is above the 50-day SMA indicator. The Stochastic Oscillators are 97.59 and 98.13 range values within the overbought region. At this point, the base crypto may allow running a bit upward more before resisting at a higher trading zone to let the counter-trading crypto regain its lost stance.
Read more:
Join Our Telegram channel to stay up to date on breaking news coverage