Join Our Telegram channel to stay up to date on breaking news coverage
The Celestia price prediction may continue to settle above the 9-day and 21-day moving averages as the coin heads to the upside.
Celestia Prediction Statistics Data:
- Celestia price now – $7.20
- Celestia market cap – $1.40 billion
- Celestia circulating supply – 196.2 million
- Celestia total supply – 1.05 billion
- Celestia Coinmarketcap ranking – #55
According to the above statistics, it’s often recommended to be as early as possible to crypto projects, as early investments can yield significant returns. For instance, Celestia (TIA) has shown remarkable price movements. In the past 24 hours, its price ranged from $5.99 to $7.24. While it reached an all-time high of $20.91 on February 10, 2024, it has since fallen by 66.15%. However, from its all-time low of $2.03 on October 31, 2023, Celestia has surged by 249.03%, showcasing the potential benefits of early investment despite market volatility.
TIA/USD Market
Key Levels:
Resistance levels: $11.0, $12.0, $13.0
Support levels: $3.0, $2.0, $1.0

Looking at the daily chart, Celestia (TIA/USD) has surged approximately 18.89% to trade around $7.20, marking a notable increase. This uptrend, although substantial, aligns with expectations set by its 21-day moving average and its previous price levels around $6.04, suggesting a foreseeable 50% increase. Following such extended movements, markets typically witness a rebound, supported by Celestia’s recent breakout on the daily chart from a trend line connecting previous highs around $7.24. This pattern of higher highs and higher lows indicates a bullish trend, reinforcing the current upward momentum.
Celestia Price Prediction: What Could be the Next Direction for Celestia?
The Celestia price has displayed a downtrend on its daily chart, albeit with recent signs of recovery through higher lows and higher highs. Resistance is noted near $7.24, with the potential for further gains toward $7.50 upon breaching this level. However, doubts linger over the sustainability of this rally, as the broader outlook remains bearish while daily trends continue to exhibit lower highs and lower lows. Despite a notable spike within the channel, the bears may need to increase the buying pressure to push the price to the resistance levels of $11.0, $12.0, and $13.0 respectively.
Nevertheless, for Celestia (TIA) to shift toward a bullish trajectory, surpassing the $7.30 mark is crucial. Until then, it remains entrenched in a bearish phase. Positive signals such as bullish divergences on the daily chart and upward trending moving averages offer encouragement, yet definitive confirmation hinges on substantial moves. Despite being the top performer in the past 24 hours, Celestia’s long-term prospects necessitate patience, with the current uptick potentially representing a temporary rebound rather than a sustained bullish trend. However, any bearish slide below the 9-day and 21-day moving averages could hit the supports at $3.0, $2.0, and $1.0.
TIA/BTC May Spike to the Upside
Against Bitcoin, the Celestia price may need to keep hovering above the moving averages for it to reach the resistance level of 1500 SAT. However, this resistance level is expected to effectively exceed so that the market price may end up closing above the upper boundary of the channel.
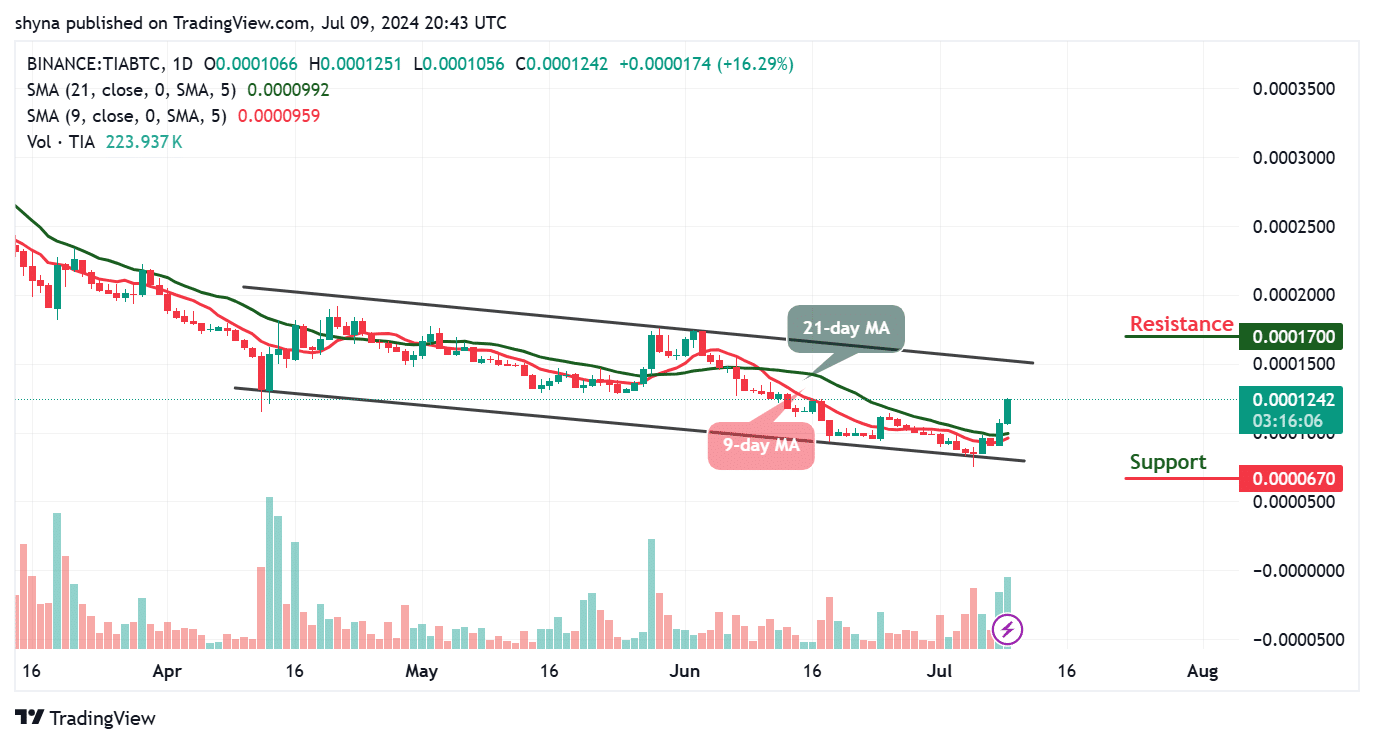
On the contrary, if TIA/BTC slides below the 9-day and 21-day moving averages, it could refresh lows under 700 SAT and a possible bearish continuation may likely meet the major support at 670 SAT and below but if the coin crosses above the upper boundary of the channel, it could hit the potential resistance at 1700 SAT and above as the 9-day MA moves to cross above the 21-day MA to give more bullish signals.
Moreover, @SatoshiFlipper shared an analysis of the $TIA daily chart with his 203k followers on X (formerly Twitter), stating that breaking out of the 8-month-long consolidation channel at $8.50 will set the stage for significant gains. He emphasized that the longer the consolidation period, the stronger the subsequent price surge.
$TIA/usdt DAILY
Break out of this 8 month long consolidation channel @ $8.50 for the real fun to begin … the longer the consolidation, the harder the pump, LFG 🚀🚀 pic.twitter.com/S6a8BQAiQr
— Satoshi Flipper (@SatoshiFlipper) July 9, 2024
Alternatives to Celestia
Celestia (TIA) is currently trading above its 9-day and 21-day moving averages. Increased buying pressure could push its price to the $7.50 resistance level and potentially further to $8.00. Despite holding the 55th position in the cryptocurrency market with a market cap of $1.40 billion, its growth potential appears limited. However, this has shifted trader interest to PlayDoge ($PLAY), which has already raised over $5.5 million in its presale and continues to sell out quickly. Even amidst overall market pullbacks and turbulence in the cryptocurrency space, PlayDoge is targeting a highly responsive demographic and performing exceptionally well.
PlayDoge Poised for a Successful Launch Amid Rising Retail Optimism
With its impressive performance, now is the perfect time to invest more in PlayDoge. Don’t miss out on this chance to be part of a rapidly rising project and potentially reap significant rewards.
Related News
- Celestia Price Prediction: TIA Soars 65% In Seven Days, But This Casino Presale Coin Might 100x
- PlayDoge Presale Surges Past $5.5M Despite Market Slump – Best Crypto To Play The Next Bull Run?
Join Our Telegram channel to stay up to date on breaking news coverage