Join Our Telegram channel to stay up to date on breaking news coverage
The Cartesi price prediction is getting ready to cross above the upper boundary of the channel after a rapid retracement.
Cartesi Prediction Statistics Data:
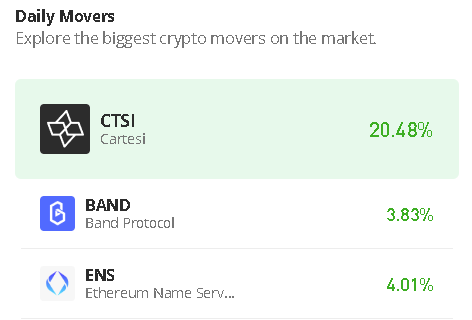
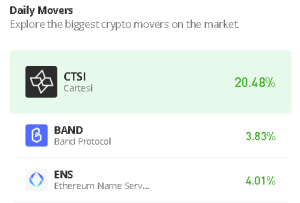
- Cartesi price now – $0.18
- Cartesi market cap – $126 million
- Cartesi circulating supply – 741 million
- Cartesi total supply – 1 billion
- Cartesi Coinmarketcap ranking – #172
CTSI/USD Market
Key Levels:
Resistance levels: $0.25, $0.27, $0.29
Support levels: $0.09, $0.07, $0.05
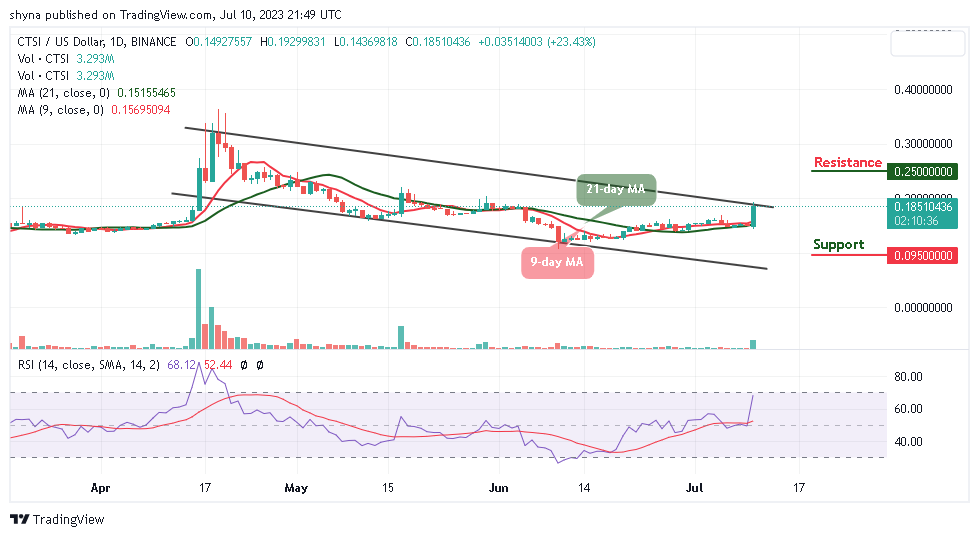
CTSI/USD is currently hovering above the opening price of $0.149 and it is likely to climb above $0.20 soon. Meanwhile, the Cartesi price is now trading above the 9-day and 21-day moving averages as bulls begin to dominate the market.
Cartesi Price Prediction: CTSI Could Reach $0.25 Level
The Cartesi price may cross above the upper boundary of the channel. However, if CTSI/USD breaks above the channel, it could visit an important resistance at $0.20. Therefore, a successful break above this level could open another increase above the $0.22 level and the price is likely to rise toward the $0.25, $0.27, and $0.29 resistance levels in the next positive direction.
Moreover, the technical indicator, Relative Strength Index (14) is moving to cross into the overbought region, the market may continue to break into the upside but any bearish cross below the 9-day and 21-day moving averages could touch the $0.14 support. The next major support is toward the lower boundary of the channel, where the bulls are likely to take a strong stand but any further losses could lead the price to $0.09, $0.07, and $0.05 support levels.
When compares with Bitcoin, the Cartesi price is now moving above the 9-day and 21-day moving averages as the market keeps moving around the upper boundary of the channel. Meanwhile, the technical indicator Relative Strength Index (14) sets to cross into the overbought region confirming the bullish movement.

However, if the price breaks above the channel, bulls might push the market to the resistance level of 800 SAT. Moreover, if the price stays above this level, it could hit the resistance level of 850 SAT and above. On the other hand, crossing below the moving averages may locate the support level at 300 SAT and below.
Alternatives to Cartesi
The Cartesi price is creating a new bullish movement as the coin crosses above the 9-day and 21-day moving averages to touch the daily high at $0.20 and also could make a bullish cross above the upper boundary of the channel if buyers increase the buying pressure.
On that note, the Wall Street Bets group has more than a million members, who are more than happy to back this new project. This is a clear advantage of $WSM over other meme coins and serves as a clear indication of its future potential. However, the token has raised almost $13 million in the ongoing presale.
New OKX Listing - Wall Street Memes

- Established Community of Stocks & Crypto Traders
- Featured on Cointelegraph, CoinMarketCap, Yahoo Finance
- Rated Best Crypto to Buy Now In Meme Coin Sector
- Team Behind OpenSea NFT Collection - Wall St Bulls
- Tweets Replied to by Elon Musk
Join Our Telegram channel to stay up to date on breaking news coverage