Join Our Telegram channel to stay up to date on breaking news coverage
Cardano (ADA) Price Analysis – April 14
Following a bearish sentiment, Cardano market has been moving side-way for the past three days as a price break is expected to play out on either way. An upward move could kick-start another bull-run. If otherwise, the bearish sentiment would continue within a channel.
ADA/USD Market
Key Levels:
Resistance levels: $0.09, $0.1, $0.12
Support levels: $0.073, $0.06, $0.05
For the past ten days, however, ADAUSD has been maintaining a slow bearish formation which is quite revealing in a falling channel pattern. Cardano’s market has been choppy since April 12 opening; showing indecisive trading. The 4-hours RSI has since been positioned on a side-way trend.
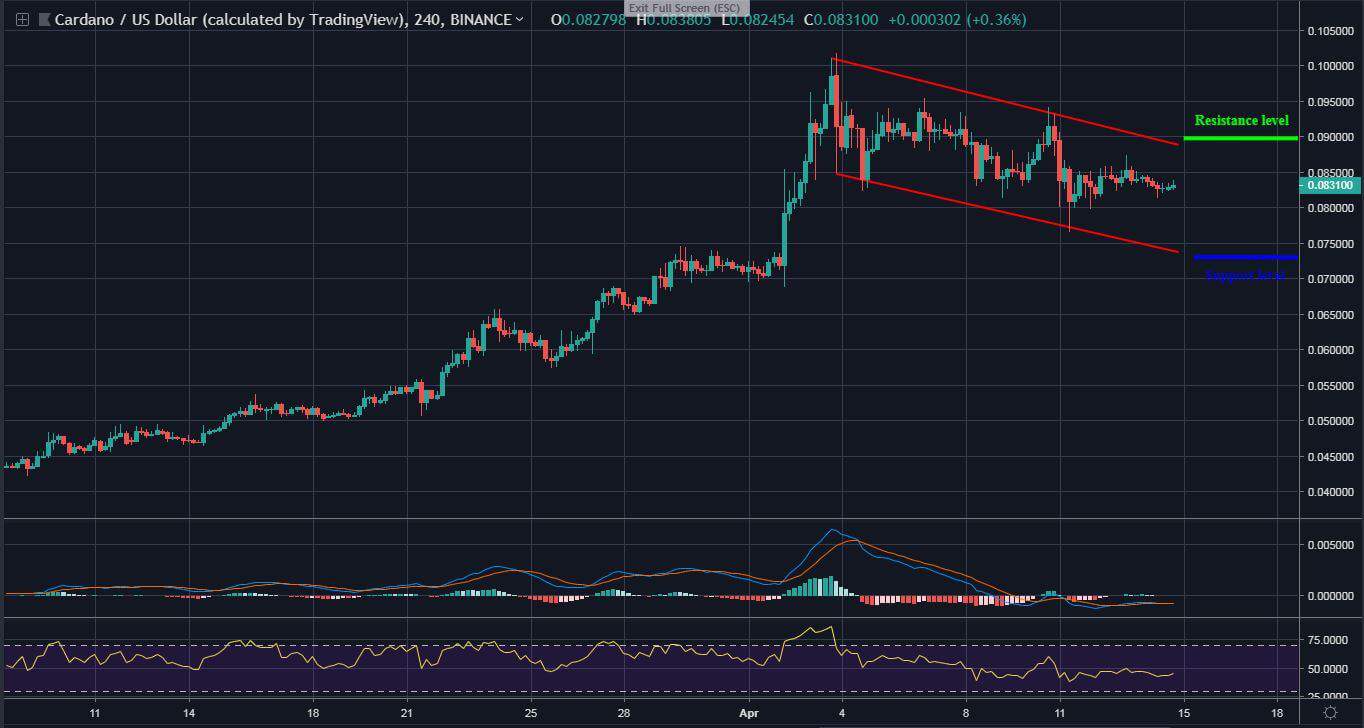
In fact, the medium-term MACD is revealed horizontally below the zero level. A positive move could swing price up to $0.09 resistance level and above. A negative move may further drop the token to $0.073 support level and beyond.
Before now, the 40 level of the medium-term RSI has become a strong defensive line for the bulls’ side since the early March rise. A successful breach below this level could lead to a more bearish scenario.
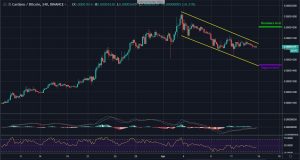
ADA/BTC Market
Cardano began a bullish reversal on March 4 after holding the price at 1100 SAT low. The upward movement propelled buying momentum to a monthly high of 1944 SAT on April 3; gaining 87% within a month. The scenario is shown on the 4-hours MACD.

Currently, ADABTC appeared to be following a falling channel after recording the monthly in the past two weeks. Resting close to the upper trend line, the token is expected to drop to 1450 SAT support; testing the lower trend line. However, a fall below 1450 SAT could send the price to 1300 SAT support and below.
Similarly, a possible spike may push price at 1800 SAT resistance level, resuming a buying pressure. As the 4-hours RSI is leveled at 40, the sellers are yet to exhaust momentum.
Join Our Telegram channel to stay up to date on breaking news coverage