Join Our Telegram channel to stay up to date on breaking news coverage
The Cardano price prediction reveals that ADA may find a halt at $0.50 as the price is down by 5.99% over the last 24 hours.
Cardano Prediction Statistics Data:
- Cardano price now – $0.43
- Cardano market cap – $14.6 billion
- Cardano circulating supply – 33.7 billion
- Cardano total supply – 34.2 billion
- Cardano Coinmarketcap ranking – #7
ADA/USD Market
Key Levels:
Resistance levels: $0.70, $0.75, $0.80
Support levels: $0.25, $0.20, $0.15
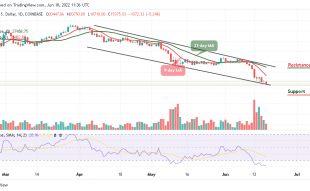
ADA/USD price is sliding below the 9-day and 21-day moving averages, and the coin may drop further lower to find support at the $0.40 level. Therefore, if the bears continue to push the market further lower, the immediate support below the $0.35 level may be located. Beneath this, further supports may be found at $0.25, $0.20, and $0.15.
Cardano Price Prediction: ADA Price May Consolidate at the Downside
According to the daily chart, if the buyers can hold the support at $0.43, the Cardano price may begin to climb higher, and bulls could expect immediate resistance to be located above the 9-day and 21-day moving averages, which is not too close to the upper boundary of the channel.
However, crossing above the upper boundary of the channel may locate the higher resistance levels at $0.70, $0.75, and $0.80. Meanwhile, the technical indicator Relative Strength Index (14) is moving below the 40-level, which shows that the market price may drop more.
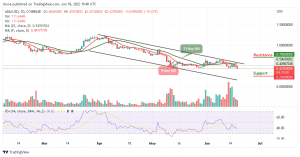
ADA/BTC Market: Cardano Price Faces the Upside
When compared with Bitcoin, the Cardano price is moving to the upside within the channel, where the price is expected to cross above the upper boundary of the channel. Therefore, should the price head to the downside, the market could hit the support level at 2100 SAT and below.
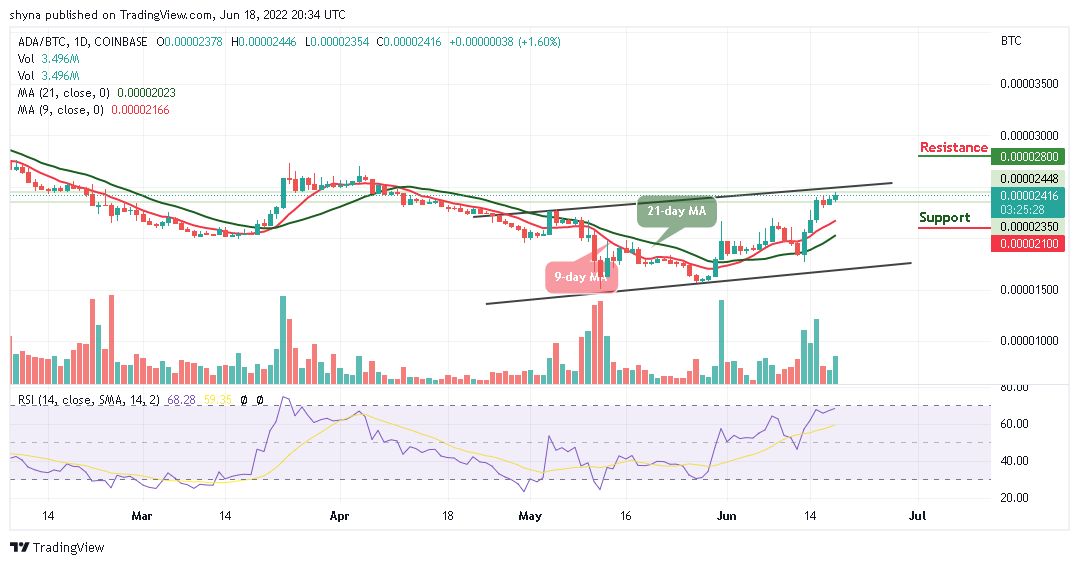
However, if the bulls continue to manage and push the market towards the north, it may cross above the channel. If successful, the ADA price may reach the resistance level of 2800 SAT and above. More so, the technical indicator Relative Strength Index (14) confirms that the market is been controlled by the buyers as the signal line moves to cross into the overbought region.
Read more:
Join Our Telegram channel to stay up to date on breaking news coverage