
Join Our Telegram channel to stay up to date on breaking news coverage
The Cardano price prediction reveals that ADA begins to form higher as the bears push the coin above the channel.
Cardano Price Statistics Data:
- Cardano price now – $0.52
- Cardano market cap – $17.6 billion
- Cardano circulating supply – 33.7 million
- Cardano total supply – 34.2 billion
- Cardano Coinmarketcap ranking – #7
ADA/USD Market
Key Levels:
Resistance levels: $0.65, $0.70, $0.75
Support levels: $0.40, $0.35, $0.30
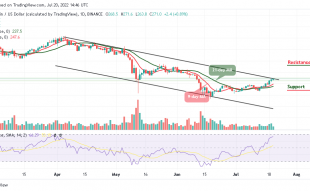
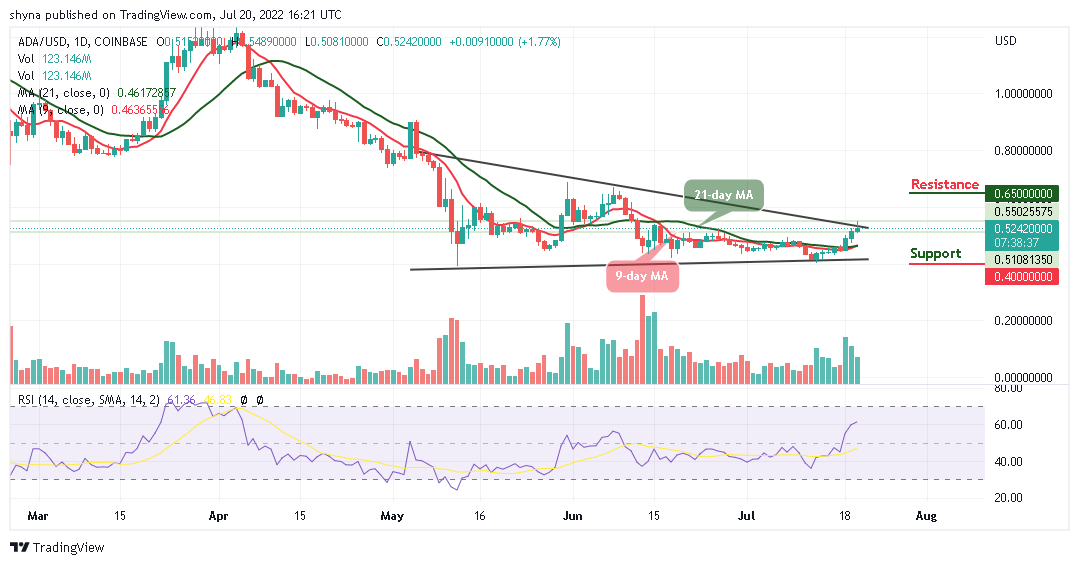
ADA/USD is likely to cross above the upper boundary of the channel as the coin touches the resistance level of $0.54. However, since a few days ago, ADA/USD has been trading above the 9-day and 21-day moving averages and this refrains the coin from going back to the support level of $0.50.
Cardano Price Prediction: Will Cardano Continue to Move Higher?
The Cardano price is ready to create move additional bullish movement as the coin continues to rise and could probably cross above the upper boundary of the channel if the bulls hit the $0.55 resistance level. Therefore, any further bullish movement above this barrier may push the price to the potential resistance levels of $0.65, $0.70, and $0.75.
Nevertheless, this technical Prediction may be invalidated if the bears break below the 9-day and 21-day moving averages, any further bearish movement may reach the support levels of $0.40, $0.35, and $0.30. Moreover, the technical indicator Relative Strength Index (14) is crossing above the 60-level to give to keep the coin in the next positive direction.
ADA/BTC Market: Price Moves to the Upside
Against Bitcoin, the Cardano price is attempting to cross above the 9-day and 21-day moving averages with a major resistance level of 2400 SAT. The long-term moving averages may likely keep the bullish movement as the market is starting a new trend by crossing above the 21-day moving average.
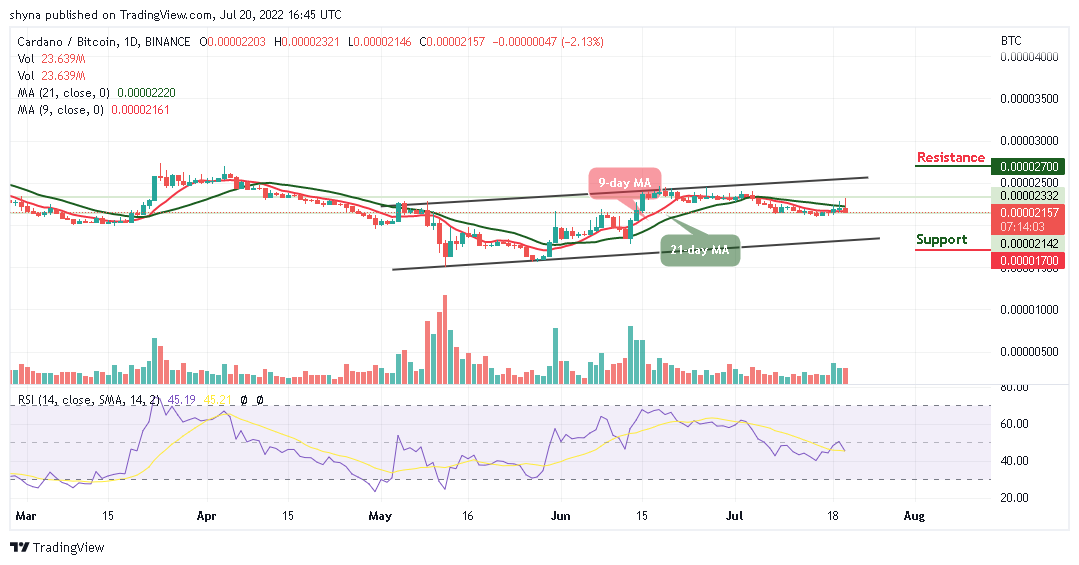
However, if the buyers could push the price towards the upper boundary of the channel, higher resistance could be located at 2700 SAT and above while the technical indicator Relative Strength Index (14) remains below 50-level, indicating that sellers are likely to play out. Moreover, should the bulls fail to move the current market value above the aforementioned barrier, the bears may step back into the market, and the nearest support level could be located at 1700 SAT and below.
Read more:
Join Our Telegram channel to stay up to date on breaking news coverage