Join Our Telegram channel to stay up to date on breaking news coverage
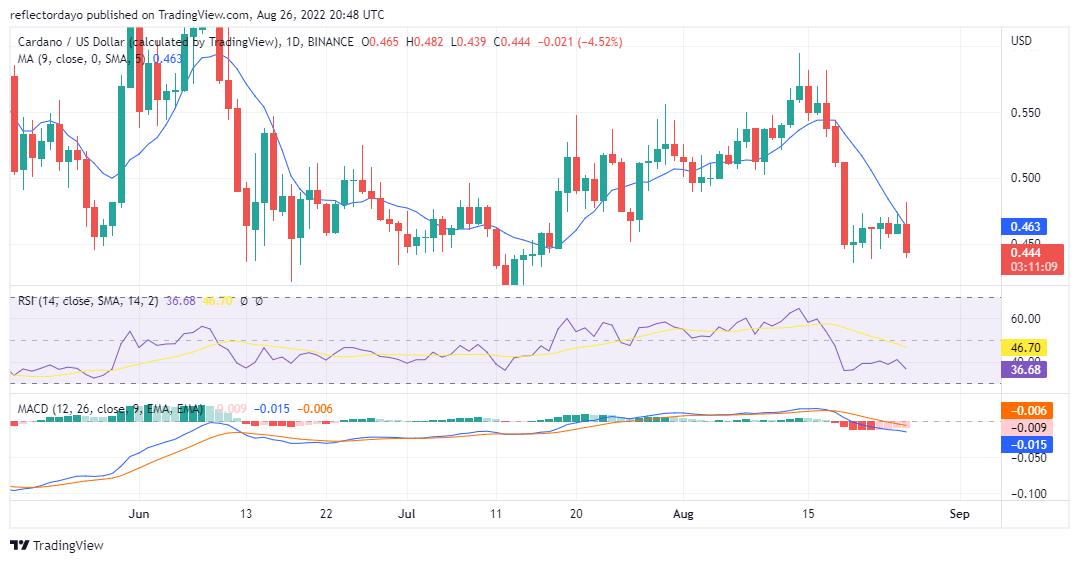
After a three-day ADA/USD bearish trend, the buying pressure became strong enough on the 20th of August to stop any more downward trends. The market action for that day (the 20th) shows a serious struggle between the forces of buyers and sellers. The buying pressure was only able to hold up the selling pressure in a sideway-ranging market pattern for six days. Today, the bearish market resumes. However, today did not start bearish. The bullish price action initially aims at breaking the $0.482 resistance level, then bears forced the price down below the bullish opening price. Although bearish momentum tries to regain the market, at the end of the day, it seems like the market favours bears
Cardano Price Statistic:
- ADA/USD price now: $0.4447
- ADA/USD market cap: $ 15,011,734,893
- ADA/USD circulating supply: 33.75Billion
- ADA/USD total supply: 34,277,702,082
- ADA/USD coin market ranking: #8
Key Levels
- Resistance: $0.463, $0.512, $0.539
- Support: $0.438, $0.418,$0.384
Your capital is at risk
Cardano Price Analysis: The Indicators Point of View
From the middle of July, the market was in favour of bulls as price action trended up with the characteristics of higher lows candlesticks pattern. Since then, the Relative Strength Index line oscillated in the stronger zone of the indicator. Although It tested the lower zone several times, it did not drop into the weaker zone until the 17th of August when the price fell by 19%. Then the indicator line began to move in the weaker zone of the RSI ranging with the price action for the six days. The price will likely fall more as the line at 37% still points downward. On the contrary, the Moving Average Convergence and Divergence show that the price is recovering to the upside. Looking at the negative histogram, today’s histogram and the three previous histograms were pink. This is a sign that the trend is weakening and a rebound in price may be imminent.
Cardano Price Analysis: ADA/USD 4-Hour Chart Outlook
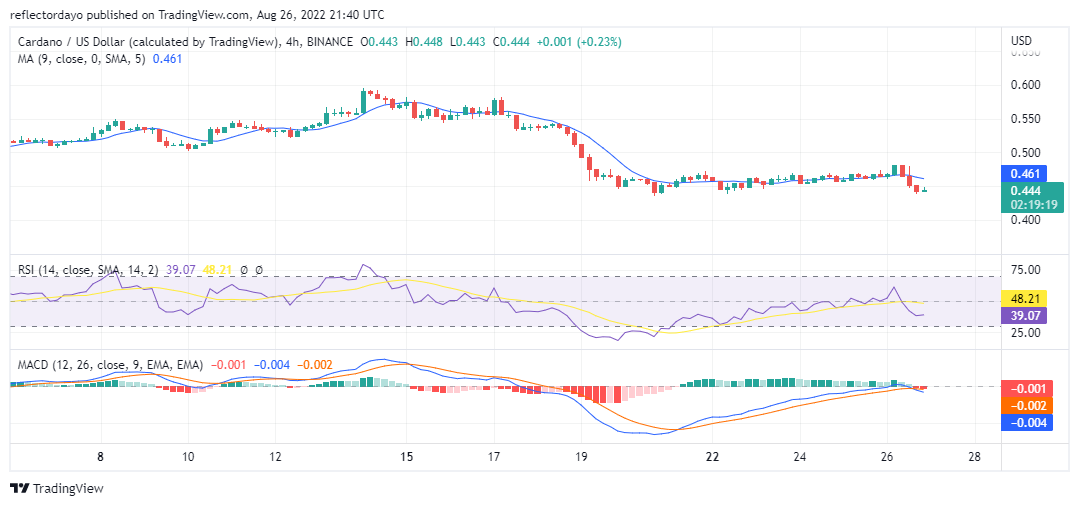
Looking at this timeframe, we can see that early today the trend was bullish. It was the strong selling pressure that dominated the 3rd to 5th trading session which is the cause of today’s bearish price action. In the last trading session, we see the buying pressure increasing momentum. If the bulls can take the last session, the trend may reverse in their favour
Related
Join Our Telegram channel to stay up to date on breaking news coverage
