Join Our Telegram channel to stay up to date on breaking news coverage
ADA Price Analysis – September 19
Cardano’s price is rising to a crucial resistance level at $0.056 and at the same time approaching the upper boundary of the channel but signaling to go down shortly.
ADA/USD Market
Key Levels:
Resistance levels: $0.060, $0.064, $0.068
Support levels: $0.040, $0.036, $0.032
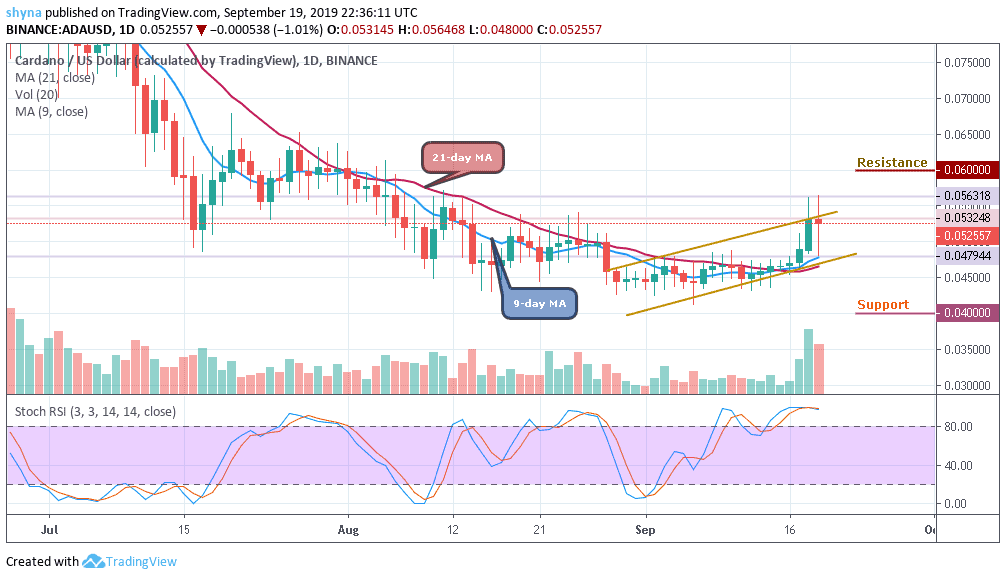
The ADA/USD pair may go bearish if the $0.053 level could no longer hold as critical technical support for the market. Cardano (ADA) had recorded a monthly high at $0.056 and the price movement is now caught in a channel pattern on the daily chart. If Bitcoin remains in a consolidation mode for a while, we can expect the bullish trend to continue in the long-term.
However, Cardano is following a long-term bullish trend, making the price to trade around $0.052 at the moment. Now, it appears that the market is about attempting a pullback, although the buyers are still gaining control of the market. We can expect the market to sell to close supports at $0.040, $0.036, and $0.032 if a pullback occurs.
More so, if the mentioned supports fail to play out, Cardano will continue to climb back to $0.0471, $0.048 and $0.049 resistance. The stochastic RSI is showing a bullish moment after crossing up to the overbought, which means the buyers are still active in the market.
ADA/BTC Market
Against BTC, the support level in this range is built around 400 SAT while the resistance is set at 595 SAT because the market price has moved above the moving averages of both 9-day and 21-day. Technically, the price started a bullish movement last week (September 13, 2019) and the trading volume is increasing as the market follows the upward movement.
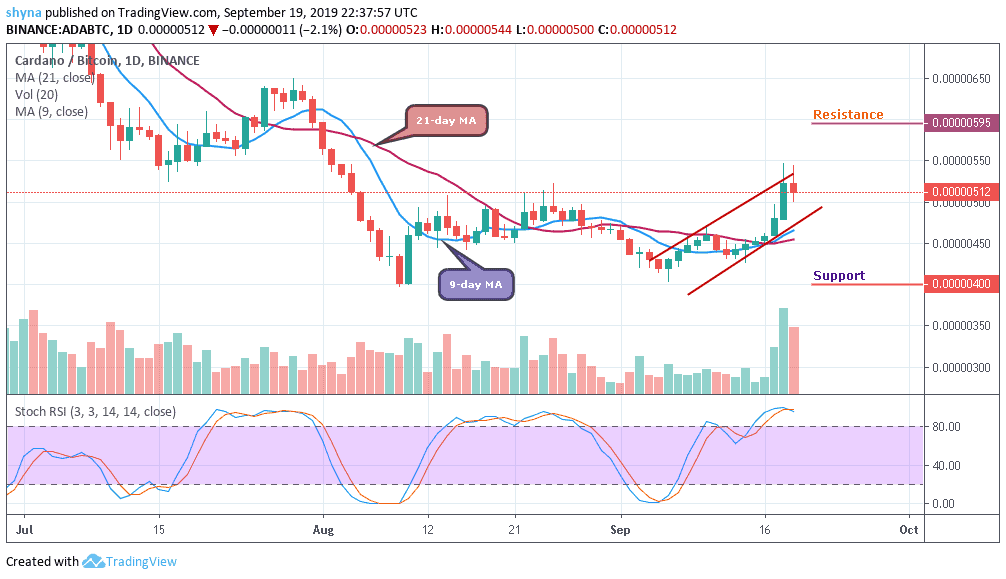
Nevertheless, the stochastic RSI indicator is bullish and it is currently generating a strong buy signal that points to the green bar of the indicator, which indicates that buyers are gaining control. But if the price drops a little bit further, the bear could signal a downward movement in the long-term for the market and the bear can now come into play.
Please note: Insidebitcoins.com is not a financial advisor. Do your research before investing your funds in any financial asset or presented product or event. We are not responsible for your investing results.
Join Our Telegram channel to stay up to date on breaking news coverage