Join Our Telegram channel to stay up to date on breaking news coverage
ADA Price Analysis – September 11
Currently, the price of ADA is consolidating around $0.046 after recording a 0.82% loss. Buying pressure may bring the market back above the 21-day moving average.
ADA/USD Market
Key Levels:
Resistance levels: $0.052, $0.054, $0.056
Support levels: $0.040, $0.038, $0.036

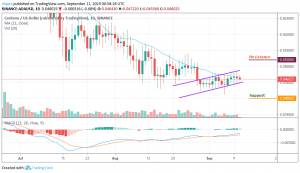
Cardano (ADA) saw a severe fall beneath the long-term support at $0.04, which is now subjected the price actions below the 21-day moving average over the past five weeks of trading. As the bears take charge, the coin is now losing momentum to the lower side of the rising wedge along with a potential price surge. Meanwhile, the MACD indicator on the daily time frame is bullish and continues to issue a buy signal.
However, the market is currently indecisive. If the bear rally continues, we can expect a wedge break-down to $0.040, $0.038 and $0.036 support levels. As it appeared now, the $0.045 level is more likely to produce a rebound for the market. Regardless of the above, the price of ADA is still looking bullish. We can expect a bounce back to $0.050 resistance. A further price push may set a bull-run for the coin along with $0.052, $0.054 and $0.056 resistance levels.
ADA/BTC Market
Compared to BTC, the support level in this range is built around 400 SAT while the resistance is set at 500 SAT because the market price has just reached the period 21 of the MA. Technically, the price started a bullish movement last week (September 6, 2019) and the trading volume is increasing as the market follows the upward movement.
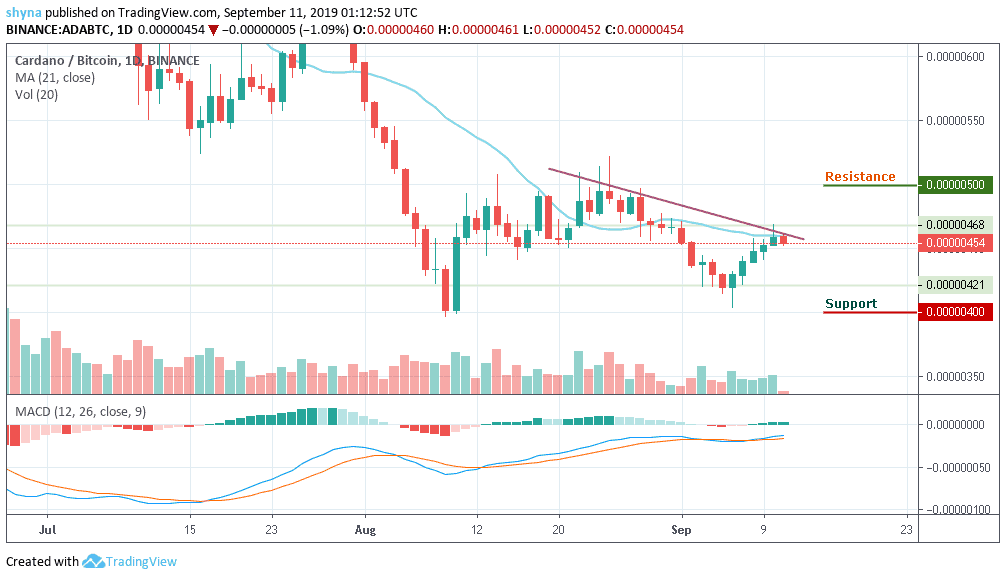
At the same time, the MACD indicator on the daily chart is bullish and is currently generating a strong buy signal that points to the green bar of the indicator, indicating that buyers are at stake. But if the price drops a little bit further, the bear could signal a downward movement in the medium term for the market and the bear can now come into play.
Please note: Insidebitcoins.com is not a financial advisor. Do your research before investing your funds in any financial asset or presented product or event. We are not responsible for your investing results.
Join Our Telegram channel to stay up to date on breaking news coverage