Join Our Telegram channel to stay up to date on breaking news coverage
This forecast reveals that Cardano is moderately bullish, and in pursuit of higher price levels. All indicator used in the analysis of this market is positive about further upside gain in this market. Also, we can observe that ADA is preserving its bullish character both against the USD and BTC counterparts.
Cardano Coin Forecast Statistics Data:
Cardano Coin’s current price: $44.00
Cardano Coin market cap: $17.4 billion
Cardano Coin circulating supply: 33.74 billion
Cardano Coin total supply: 34.3 billion
Cardano Coin Coinmarketcap ranking: #8
Important Marks:
Resistance levels: $0.5174, $0.5200, $0.5221
Support levels: $0.5170, $0.5150, $0.4900

In this forecast, we shall try to examine this market to see signs of what lies ahead for this crypto. And, we’ll try to come up with the best trading decisions for traders in this market to make.
Solana Coin Value Forecast: ADA is Trading in Moderately Upward Manner Against USD
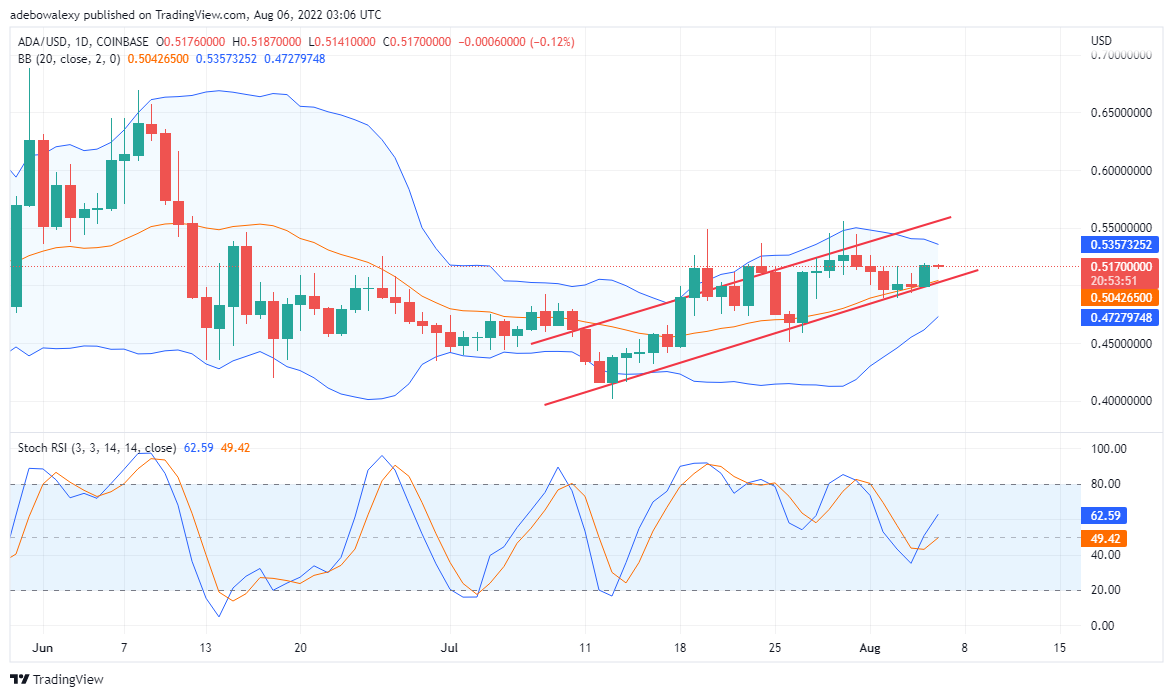
The analysis done on the ADA/USD hourly chart reveals that this crypto is trading in an upward-slopping price channel. The price channel can be seen as the two straight red forming a lower and upper band around price movements. Also, we can see that the price movement stays above the middle line of the Bollinger band indicator. Although the last candle on this chart is a bearish one, the reversal caused by this candle is insignificant. However, the significance of the reversal will be increased if selling pressure in this market increases and the next candle forms a bullish one.
Additionally, Stochastic RSI displays steeply upward-facing lines. Consequently, this is telling that the trend is strong. While these lines are yet to reach the oversold region, if the uptrend keeps gaining momentum, the value of this crypto will extend its gains. Eventually, the crypto may value at $0.5500 and subsequently $0.6000. Traders can place a buy-stop order at $0.5400.

Solana Coin Value Forecast: ADA Uptrend Is less Significant Against BTC
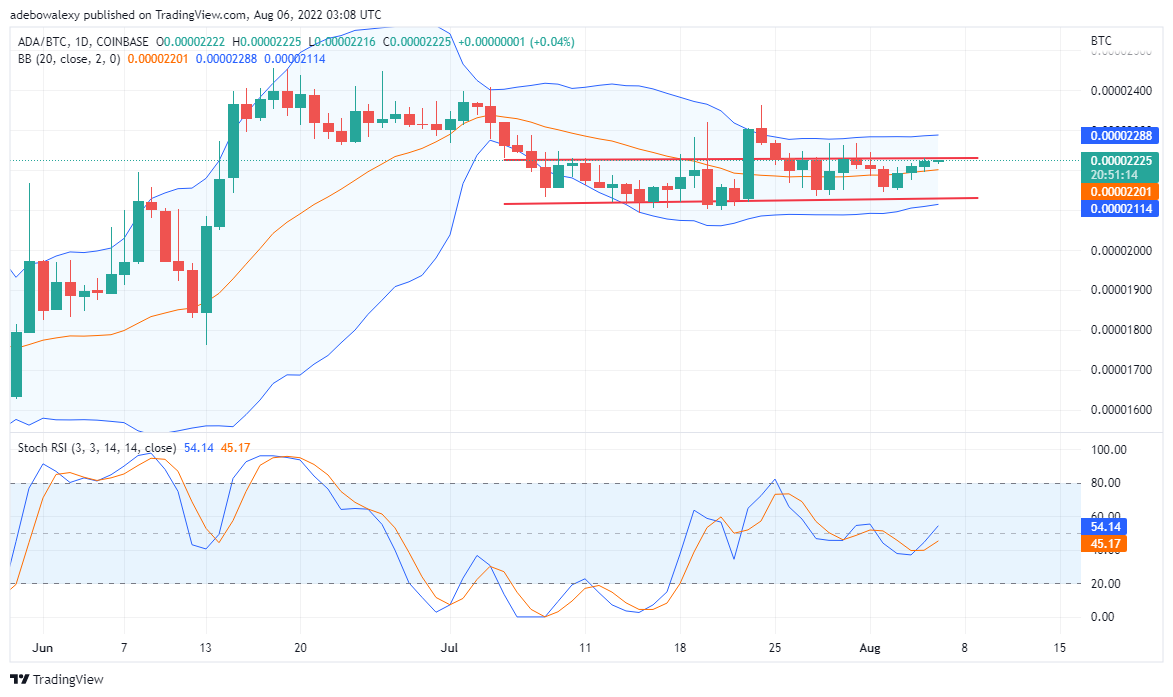
Although ADA/BTC is still bullish here as indicated by trading indicators, this bullishness is of lesser magnitude here. On the ADA/BTC chart, we can see that the last four candlesticks are all bullish. A plus to this is that three of these candles were above the middle line of the Bollinger indicator. Also, the last candle here is already testing the resistance created by the price channel.
Going by the activities portrayed on the Stochastic RSI, the resistance created by the ceiling of the price channel eventually be broken. These conclusions are coming from the fact that the Stochastic RSI threads are still at levels of 45% and 54%. This implies that value may go higher if the trend keeps gaining momentum. Eventually, values may reach 0.00002400 and 0.00002500.
Join Our Telegram channel to stay up to date on breaking news coverage

