Join Our Telegram channel to stay up to date on breaking news coverage
BTCUSD Price Analysis – July 01
Further increase in the Bears’ momentum may push down the coin to penetrate the $10,967 level and target the support level of $10,386. In case the $10,967 level holds the price may reverse towards the resistance level of $11,311.
BTC/USD Market
Key levels:
Resistance levels: $11,311, $11,643, $12,263
Support levels: $10,967, $10,386, $9,735, $9,300
BTCUSD Long-term trend: Bearish
Bitcoin price is bearish on the medium-term outlook. The Bitcoin price reached the resistance level of $12,263 on June 30. A bearish engulfing candle pattern formed at the same level; this is a bearish reversal candle pattern which triggered the Bulls’ momentum. The price dropped to the $10,967 support level. It pulled back shortly, another bearish engulfing candle was produced on June 30 which broke down the $10,967 level and the price is currently exposed to the $10,386 level.
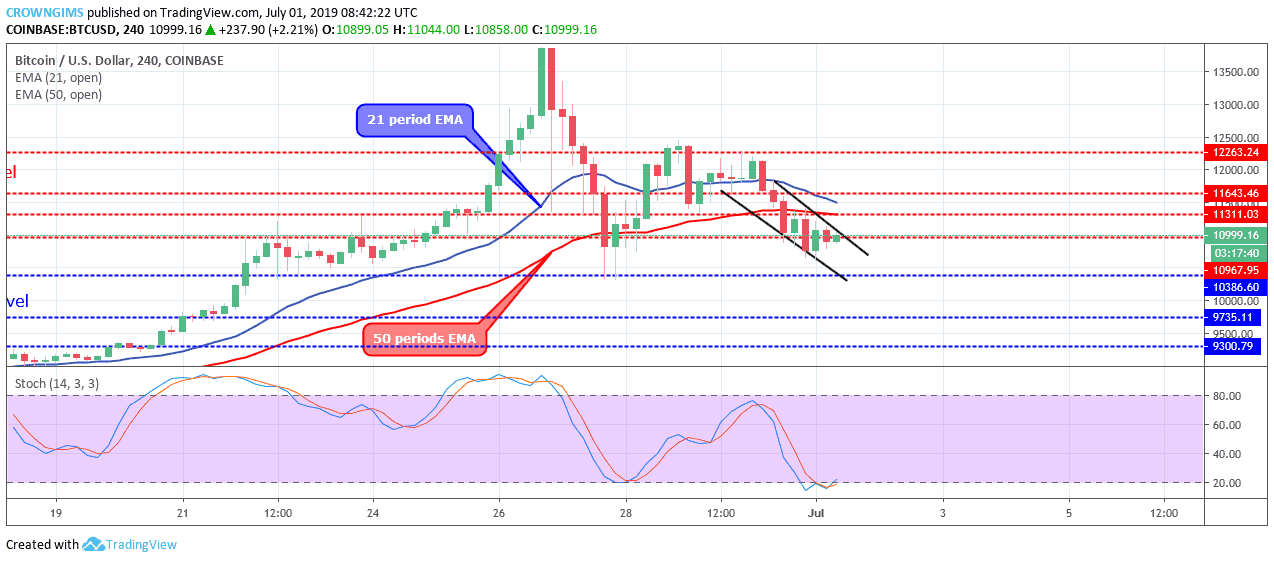
The Bitcoin price is currently at the $10,967 price level, it has crossed the two EMAs downside and it is trading below 50 periods EMA and 21 periods EMA in which the latter is trying to cross the former downside to establishing the bearish trend. The Stochastic Oscillator period 14 is at 20 levels and the signal lines bending up to indicate a buy signal.
Further increase in the Bears’ momentum may push down the coin to penetrate the $10,967 level and target the support level of $10,386. In case the $10,967 level holds the price may reverse towards the resistance level of $11,311.
BTCUSD Short-term Trend: Bearish
BTCUSD is bearish on the short-term outlook. The Bitcoin price has formed a descending channel in the 1-hour chart. The price is making lower lows within the channel. The price may decrease further in case the dynamic resistance level opposes the increase.
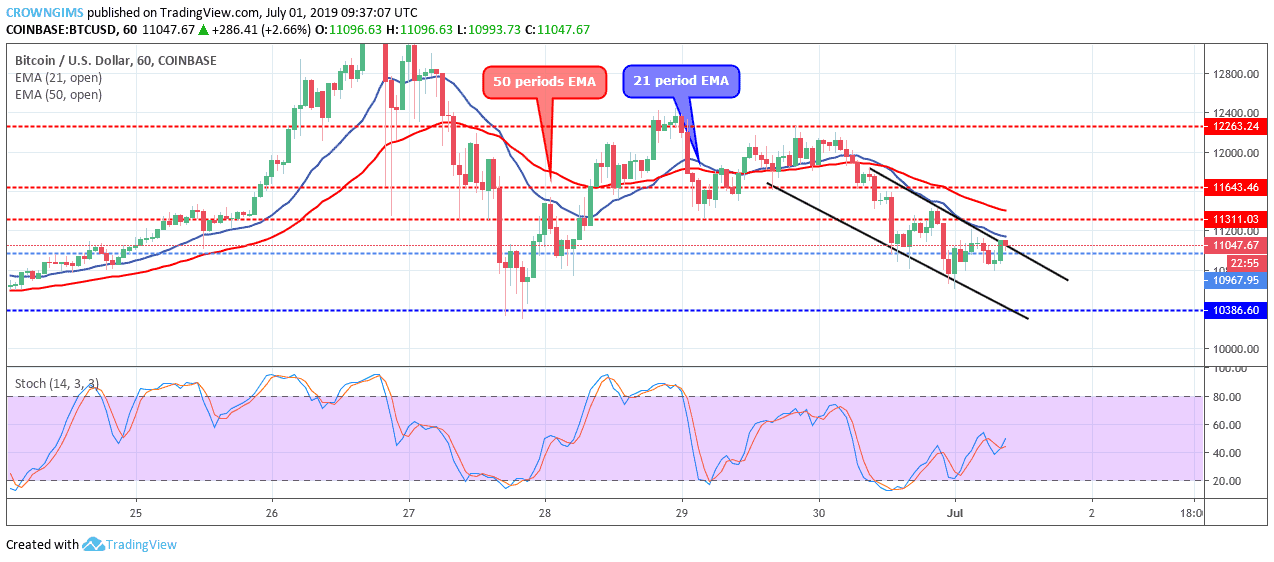
The price is trading below the 21 periods EMA and 50 periods EMA as a bearish movement sign. In case the current bearish candle closes below the $10, 967 demand level then the bearish trend may continue.
Please note: insidebitcoins.com is not a financial advisor. Do your own research before investing your funds in any financial asset or presented product or event. We are not responsible for your investing results.
Join Our Telegram channel to stay up to date on breaking news coverage