Join Our Telegram channel to stay up to date on breaking news coverage
Bitcoin (BTC) Price Prediction – September 5
BTC/USD path of least resistance remains downward even after losing over $2,000 in two days.
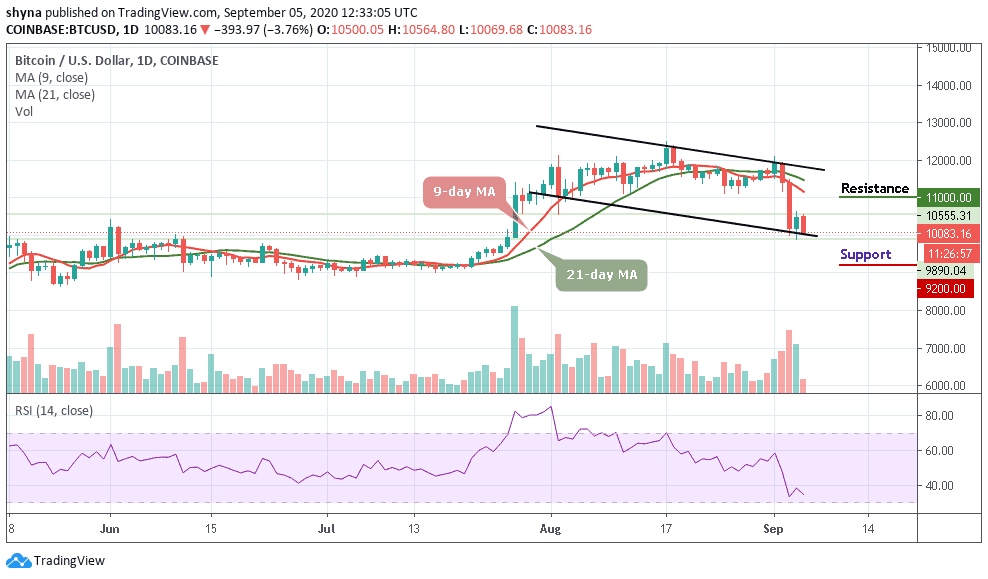
BTC/USD Long-term Trend: Ranging (Daily Chart)
Key levels:
Resistance Levels: $11,000, $11,200, $11,400
Support Levels: $9,300, $9,100, $8,900
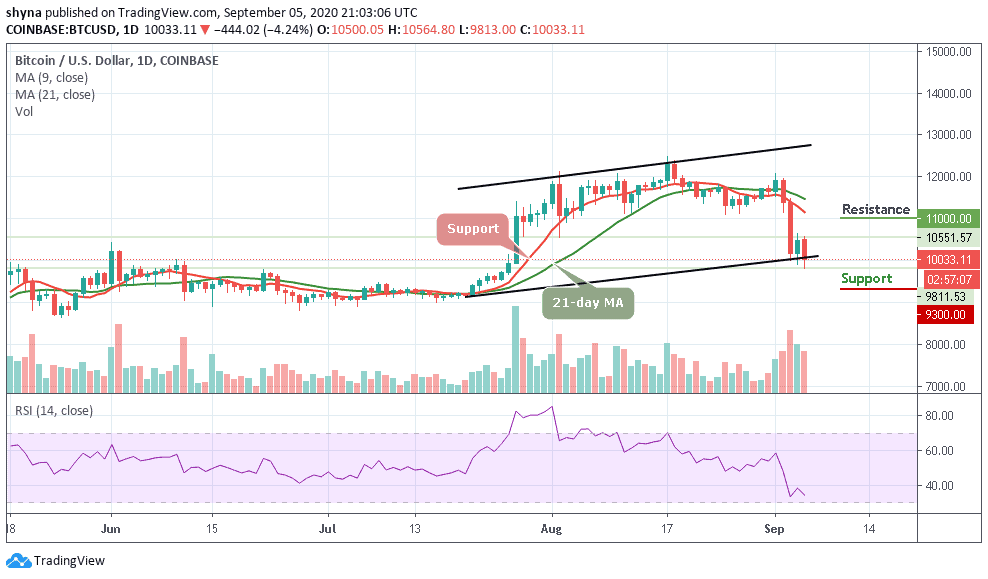
BTC/USD is down 4.24% in the last 24 hours but with a relatively strong rebound price of $10,550. If the momentum tests $10,600 resistance with support at $10,200, the Bitcoin price could go as high as $10,800. Since the past few days, BTC/USD has crashed with more than $2,000 hitting a low point of $9,813 before rebounding above $10,000 to trade at $10,033 at the time of writing.
What is the Next for Bitcoin?
On the downside, if Bitcoin rejects the higher resistance level, lower levels may be tested in a sequence of lower highs and lower lows until prices touch the next critical support level. Therefore the market may experience a lot of short-term based trades and a lot of volatility too as the technical indicator RSI (14) remains below 35-level.
However, it is important to note that BTC/USD is most likely to break south in as much as the 9-day MA remains below the 21-day MA. Its failure to hold the mid-range support level pulled prices down to its next support level at $9,813. Meanwhile, the short-term analysis indicates that BTC/USD may test higher levels with key resistance at $10,500 before a reversal. The resistance levels to watch are $11,000, $11,200, and $11,400 while the supports are located at $9,300, $9,100, and $8,900 respectively.
BTC/USD Medium – Term Trend: Bearish (4H Chart)
According to the 4-hour chart, BTC/USD has been facing immense turbulence throughout the past several days, with sellers forcing its price down to the lows of $9,878 this morning following yesterday’s defense of the upper $9,819 region. If the bulls decide to push the market price above the moving averages, the coin may likely hit the resistance at $10,800 and above.
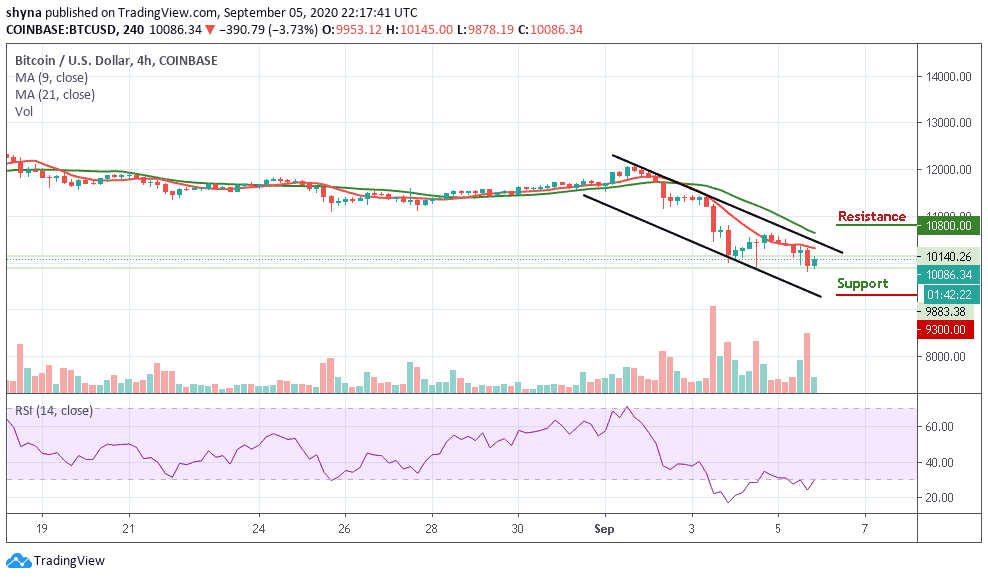
Moreover, it now appears that the cryptocurrency is at risk of seeing further downside in the near-term, as the multiple attempts to shatter its $10,000 support seem to indicate that bears are building momentum. As the RSI (14) remains within the oversold, the coin may locate the critical supports at $9,300 and below.
Join Our Telegram channel to stay up to date on breaking news coverage