Join Our Telegram channel to stay up to date on breaking news coverage
Bitcoin (BTC) Price Prediction – January 30
The Bitcoin bulls are running out of options and it is either they break above $35,000 or risk plunging under $30,000.
BTC/USD Long-term Trend: Ranging (Daily Chart)
Key levels:
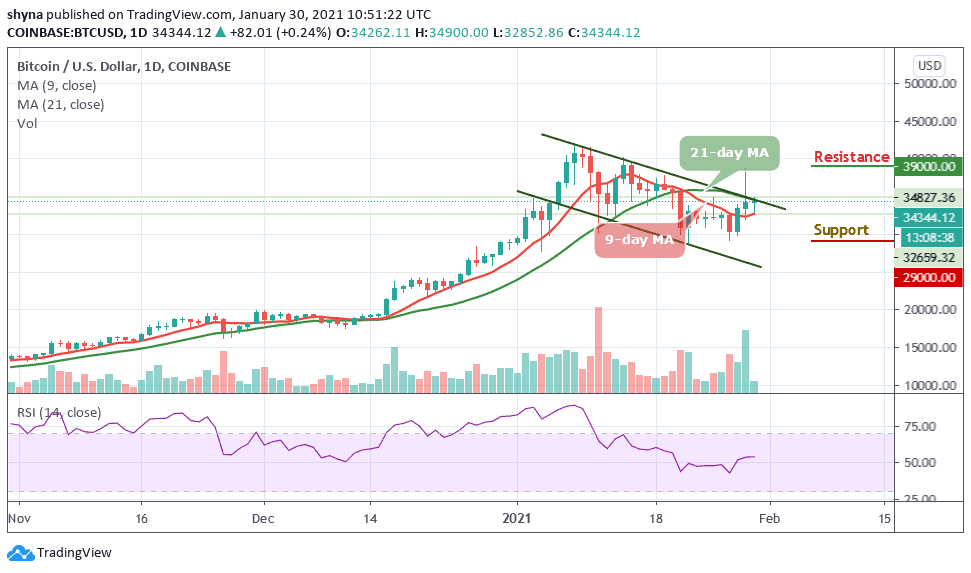
Resistance Levels: $38,000, $40,000, $42,000
Support Levels: $30,000, $28,000, $26,000

BTC/USD explores low under $34,000 as the price hovers at $33,823. The market price is now adjusting upwards. However, the prevailing trend is ranging while the volatility remains calm within the market. The Bitcoin price is currently correcting upwards above the 9-day moving average as it is yet to settle above the 21-day moving average.
Where is BTC Price Going Next?
Although the bulls seem to reclaim back the control of the market as they are staring into a potential resistance level at $35,000. Moreover, if Bitcoin bulls manage to clear the above resistance, they are likely to gather overwhelming support to catapult them towards the resistance levels of $38,000, $40,000, and $42,000.
On the downside, the beginning of the resistance zone $32,000 is playing a double function as a support. So, in the case of a reversal and extended declines, BTC/USD may likely find support at $30,000, $28,000, and $26,000. The technical indicator RSI (14) continued to trend in the same direction above the 50-level with an indication of indecision in the market.
BTC/USD Medium-Term Trend: Ranging (4H Chart)
The 4-hour chart for Bitcoin is still looking slightly bullish, but the market has been showing a sign of weakness since the daily opening. However, the intraday trading is looking bullish; following the recent rebound at $32,850 which is now a key support level. The next key support levels are $32,500, $31,500, and $30,500.
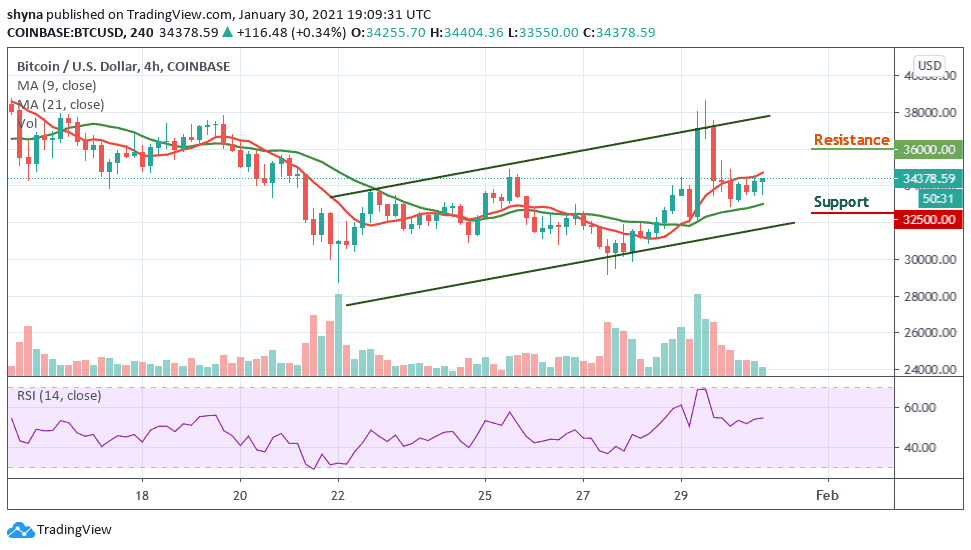
However, considering the recent sharp rebound, the Bitcoin price may re-enter the bullish rally to $35,000 resistance. A climb above the mentioned resistance may further push BTC price to $36,000, $37,000, and $38,000 resistance levels. As it is now, it seems the market may move sideways as the RSI (14) is now moving in the same direction around the 54-level.
Join Our Telegram channel to stay up to date on breaking news coverage