Join Our Telegram channel to stay up to date on breaking news coverage
Bitcoin (BTC) Price Prediction – January 30
The Bitcoin price is currently consolidating and seems to be preparing for the next move either above $38,000 or towards $40,000.
BTC/USD Long-term Trend: Bullish (Daily Chart)
Key levels:
Resistance Levels: $39,000, $41,000, $43,000
Support Levels: $29,000, $27,000, $25,000
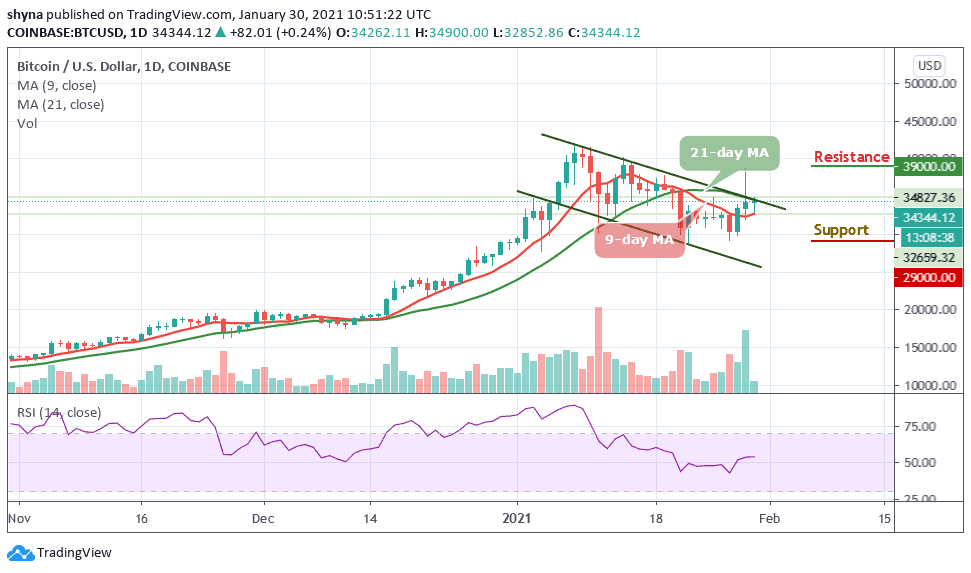
BTC/USD started the day with a downside movement as the coin touched $32,852 in the early hours of today, but later, BTC/USD market begins to improve as the price moves out of the downside to the upside. However, within the few hours of the day, BTC/USD is now trading above the 9-day MA and about to cross above the 21-day MA but now changing hands at $34,344.
What to Expect from Bitcoin (BTC)
BTC/USD remains in consolidation in spite of a breakout above the 9-day moving average. The bulls establish a higher low and only need to climb above $38,500 to confirm a daily uptrend. At the time of writing, the trend is in the favor of the bulls and if the situation remains unchanged, BTC/USD may begin to grind north as the technical indicator RSI (14) remains above the 50-level.
However, the coin could bring down the seller congestion below the moving averages. Meanwhile, if it crosses above the upper boundary of the channel, there is a chance that a new path to $39,000, $41,000, and $43,000 resistance levels may be created. For now, all the attention should go towards overcoming the hurdle at $35,500 and defending support at $30,500. Meanwhile, going below $30,000 may likely seek supports at $29,000, $27,000, and $25,000 respectively.
BTC/USD Medium-Term Trend: Ranging (4H Chart)
On the 4-hour chart, there are several important technical barriers below and above the current price at the $34,000 level. This simply means that the coin may likely spend enough time consolidating gains at the current levels as the RSI (14) moves sideways.
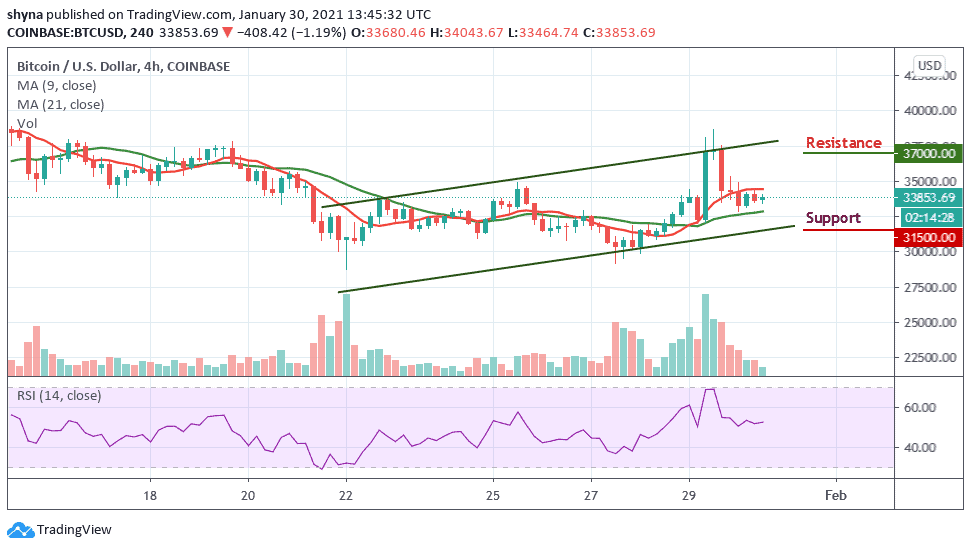
Meanwhile, in the long-run, the trend stays bullish as long as the price is above $33,000. The potential resistance level is located at $37,000 and above while the nearest supports are under the lower boundary of the channel at $31,500 and below.
Join Our Telegram channel to stay up to date on breaking news coverage