

Join Our Telegram channel to stay up to date on breaking news coverage
Bitcoin (BTC) Price Prediction – October 9
BTC/USD is currently moving below $10,900 after the king coin hits an intraday high of $10,947.
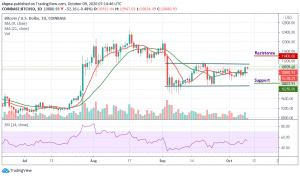
BTC/USD Long-term Trend: Ranging (Daily Chart)
Key levels:
Resistance Levels: $11,400, $11,600, $11,800
Support Levels: $10,250, $10,050, $9,850
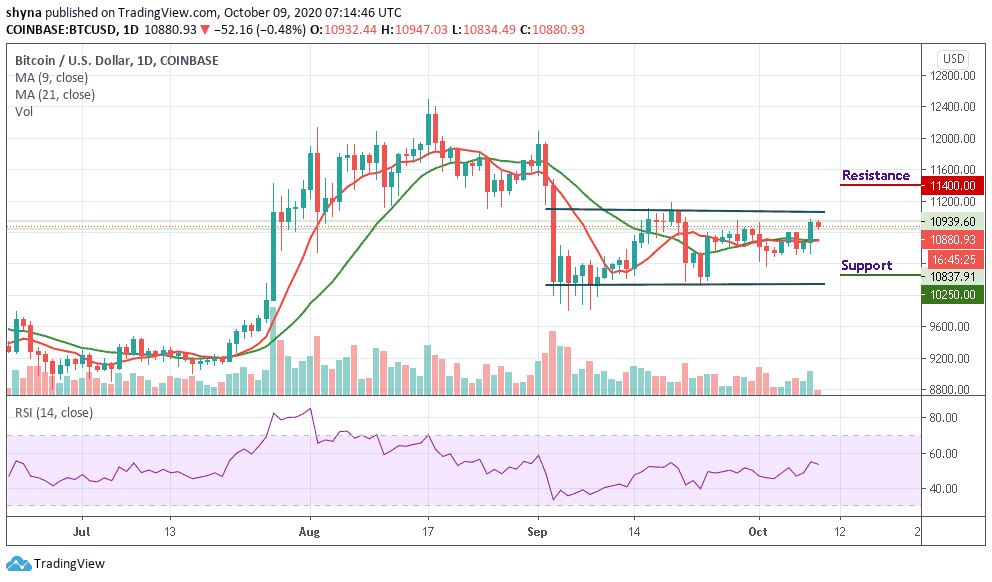
At the time of writing, BTC/USD is hovering around the $10,880 level after touching the daily high of $10,947. Although, there is a lot of sluggishness in the market as neither the bulls nor the bears are looking to hold the price by the scruff of its neck. Actually, all this may soon change, though. The Bitcoin price needs to keep going strong and pointing towards an upside breakout.
Where is BTC Price Going Next?
As BTC/USD trades around $10,880 level, the price must close above $11,000 to indeed indicate an upside opening on the daily chart. Previously, the price range between $10,500 and $10,650 acted as support. Therefore, for Bitcoin price prediction to turn more bullishly, it must be taken out decisively by the bulls to turn it into support once again and then continue the momentum forward where it could reach the resistance levels of $11,400, $11,600, and $11,800.
However, a breakout above $11,000 could boost confidence in the coin and increase overall liquidity into the system. Currently, Bitcoin’s rise would certainly give the altcoins a much-needed boost and calm the cryptocurrencies market as well. For Bitcoin to be rejected at $10,947 may eventually lead to declines below the moving averages at $10,600. Should in case the coin drops more, then it could rely on the long-term support levels at $10,250, $10,050, and $9,850 as the RSI (14) nosedives below 55-level.
BTC/USD Medium-term Trend: Bullish (4H Chart)
The long bullish candle on the 4-hour chart shows that bulls had their say at the end of yesterday. The movement above the 9-day and 21-day moving averages shows there are confidence and liquidity in bulls to take the move forward today. However, it seems that Bitcoin’s price prediction is approaching bullish confirmation.
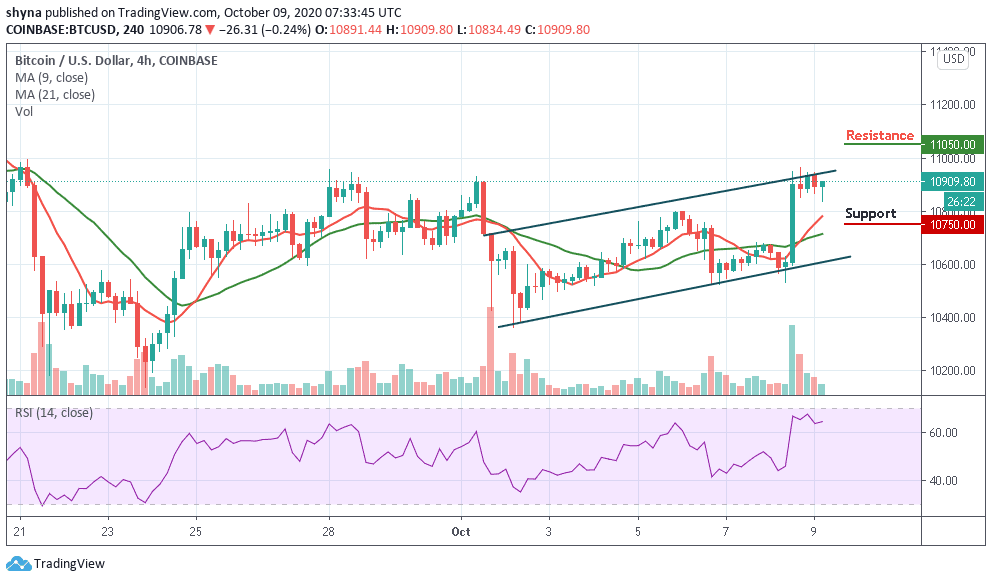
Moreover, if the current bullish move falters, profit booking may bring the price down towards the support level of $10,750 and below. However, bulls could support the price above $10,900 as they have done successfully in the past few days. But if the market price rises above the upper boundary of the channel, it may reach the resistance levels of $11,050 and above. The RSI (14) is seen moving in the same direction above 60-level, indicating a sideways movement.
Join Our Telegram channel to stay up to date on breaking news coverage
