Join Our Telegram channel to stay up to date on breaking news coverage
Bitcoin (BTC) Price Prediction – September 26
Bitcoin (BTC) is currently facing exhaustion after been rejected at higher levels.
BTC/USD Long-term Trend: Ranging (Daily Chart)
Key levels:
Resistance Levels: $11,400, $11,600, $11,800
Support Levels: $10,000, $9,800, $9,600
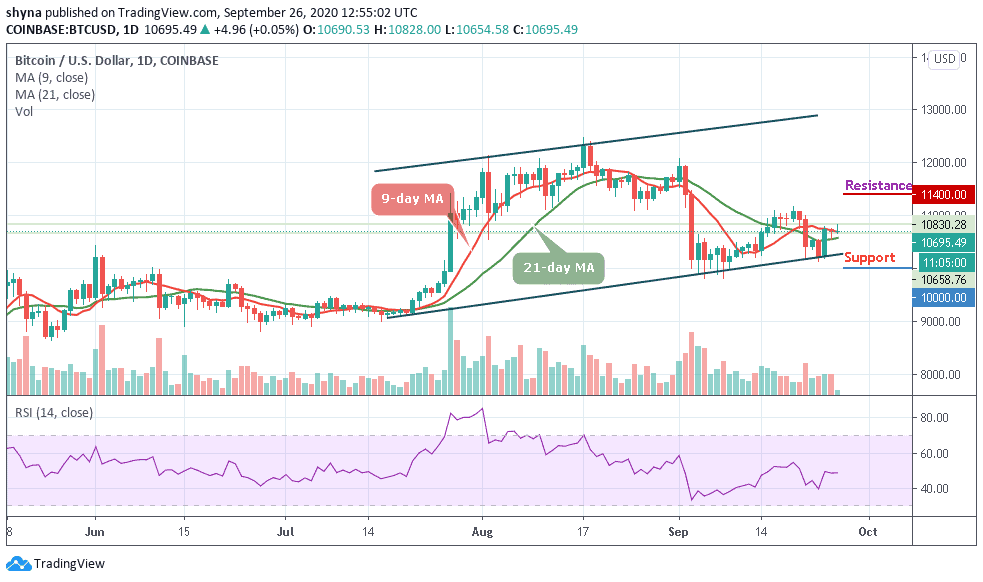
BTC/USD bulls appear to be recharging after successfully breaking back above the 9-day and 21-day moving averages touching the daily high at $10,828. At the time of writing, Bitcoin is trading at $10,695. Meanwhile, the RSI (14) shows a range-bound may play out soon but it is essential to realize that selling influence is also present and therefore, everyone must proceed with caution.
What to Expect from Bitcoin (BTC)
For Bitcoin holding above $10,500 remains key to ensuring buyers do not lose sight of the critical resistance at $11,000. Moreover, buyers must work hard to keep Bitcoin above the moving averages. A move above this barrier is likely to stir a buying frenzy in the market, attracting more investors. Therefore, if buyers overcome the seller congestion at the upper trend-line, traders can then expect BTC/USD to extend the bullish action majestically above $11,000.
Looking above that, we have the $11,400, $11,600, and $11,800 as the next set of likely resistances if Bitcoin manages to sustain its current momentum. In other words, if the bearish traders manage to defend the daily 21-day MA, however, then we should look to the $10,450 as the first area of support, falling below the lower boundary of the channel may locate the critical supports at $10,000, $9,800, and $9,600 respectively.
BTC/USD Medium-Term Trend: Bearish (4H Chart)
Looking at the 4-Hour chart, Bitcoin (BTC) has not yet slipped below the 9-day moving average and is still in the loop of making a bounce back. BTC/USD price hovers around the upper boundary of the channel and may take time to persistently cross the resistance level of $10,800. At the moment, the Bitcoin price is currently moving around $10,678 level.
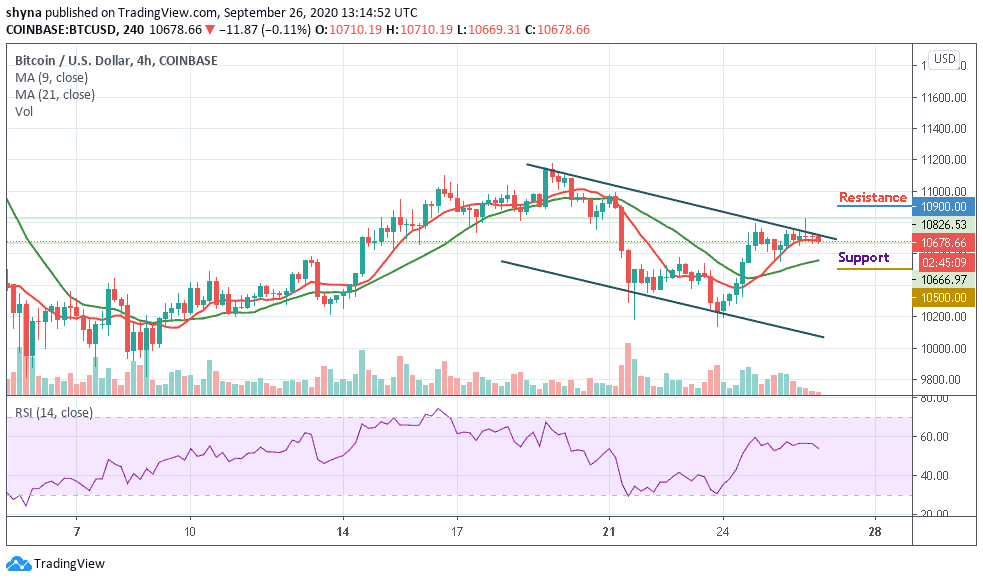
However, if BTC/USD decisively overcomes the $10,800 resistance, the next obstacles lie at $10,900 and $11,100. In other words, if the bears hold the price and push it downward, then the support level of $10,500and $10,300 may be visited as the RSI (14) may go below 55-level to indicate more bearish signals.
Join Our Telegram channel to stay up to date on breaking news coverage